Skip navigation

Tag Archives: Renewable energy

This is not an oil crisis.

It’s something deeper — and far more structural.

It’s an energy system failure.


For decades, energy systems were built on a simple assumption:

Demand is predictable. Supply is controllable.

That world no longer exists.


Today, three forces are colliding:

AI is turning electricity into continuous demand

🌬️ Renewables are inherently intermittent

🔋 Storage is still short-duration

Individually, each works.

Together, they create instability.


We are now facing a mismatch that the system was never designed for:

  • Demand is becoming time-dependent and continuous
  • Supply is becoming variable and weather-driven

And we are trying to bridge that gap with incremental fixes.

More renewables.

More batteries.

More transmission.


But here’s the uncomfortable truth:

You cannot solve a structural problem with incremental solutions.


This is why the conversation around energy is starting to shift — quietly, but fundamentally.

From technology → to system architecture


At Clean Energy and Water Technologies (CEWT), we’ve been working on this problem from a different angle.

Not just how to generate clean energy.

But how to reshape energy so it behaves like the system needs it to.


Because the real challenge is not producing energy.

It is aligning energy with time.


This is where Carbon Recycling Technology (CRT) comes in.

  • Renewable electricity is converted into hydrogen
  • Hydrogen combines with captured CO₂
  • The result is renewable methane (RNG) — a storable, dispatchable energy carrier

And when used, the CO₂ is captured and recycled again.


Carbon is no longer a liability.

It becomes a carrier.


This changes the equation:

Instead of forcing demand to follow supply,

Supply is reshaped to follow demand.


And that is the missing layer in today’s energy transition.


We are not just transitioning energy.

We are redesigning the system that carries it.


AI, industry, and global electrification are accelerating this reality.

The question is no longer whether change is needed.

It is whether we continue to optimise the old system —

or build the one that actually works.


There is no shortcut.

Closing the carbon loop is the only real path to defossilisation.


#EnergyTransition #AI #EnergySystems #Hydrogen #Decarbonisation #CRT #CEWT

Clean Energy and Water Technologies Pty Ltd (CEWT)

ABN 61 691 320 028 | ACN 691 320 028

Technology Note

Why Carbon Recycling Technology (CRT) Is Structurally Superior for Green Iron Production

Date: March 2026

Prepared for: Government agencies, investors, industrial partners


Overview

Carbon Recycling Technology (CRT) enables zero-emission iron production by combining hydrogen-rich syngas reduction with a closed carbon loop.

Unlike hydrogen-only pathways that require large new infrastructure and massive electrolysis capacity, CRT preserves the proven gas-based reduction chemistry used in Direct Reduced Iron (DRI) systems while eliminating net carbon emissions.

This approach allows the transition to green iron production using existing industrial infrastructure with significantly lower energy and hydrogen requirements.


1. Uses Proven Gas-Based Iron Reduction Chemistry

CRT reduces iron ore using hydrogen-rich syngas (CO + H₂) generated through steam reforming.

This is the same fundamental chemistry used in natural-gas-based DRI processes such as those deployed globally by Midrex.

Advantages

  • Proven shaft-furnace technology
  • Established reduction kinetics
  • Mature industrial operating experience
  • Reduced technical risk

CRT therefore builds on existing metallurgical practice rather than introducing an entirely new process.


2. Achieves Zero Emissions Through Carbon Recycling

In conventional natural-gas DRI:

Natural Gas → Reduction → CO₂ released to atmosphere

In CRT:

Natural Gas / RNG → Reduction → CO₂ captured → recycled → Renewable Natural Gas (RNG)

The carbon atom, therefore, circulates continuously within the system, acting as a recyclable carrier rather than being emitted.

This closed molecular loop allows CRT to achieve net-zero emissions without eliminating carbon from the process chemistry.


3. Dramatically Lower Hydrogen Requirement

Hydrogen-only ironmaking requires hydrogen to supply both:

  • the reducing gas, and
  • the energy source for the process

This results in very large electrolysis capacity requirements.

CRT instead uses hydrogen-rich syngas, with only a small renewable hydrogen trim required to maintain the carbon recycling loop.

Benefits

  • significantly smaller electrolysers
  • lower renewable electricity demand
  • reduced hydrogen storage requirements
  • improved economic feasibility

4. Compatible With Existing Industrial Infrastructure

Hydrogen-only steelmaking requires major changes to industrial systems, including:

  • new hydrogen production infrastructure
  • new fuel supply networks
  • modified furnaces and process systems

CRT maintains compatibility with existing infrastructure, including:

  • gas reforming systems
  • DRI shaft furnaces
  • gas handling and distribution networks
  • high-temperature industrial heat systems

This allows decarbonisation to proceed faster and at lower capital cost.


Structural Advantage of CRT

Traditional decarbonisation approaches attempt to remove carbon from industrial energy systems.

CRT instead recycles carbon as a molecular energy carrier, while renewable hydrogen provides the incremental energy required to maintain the loop.

This architecture preserves the thermodynamic advantages of carbon-based fuels while eliminating net emissions.


Conclusion

Carbon Recycling Technology provides a practical pathway for green iron production by combining:

  • proven gas-based reduction chemistry
  • closed-loop carbon recycling
  • minimal hydrogen requirements
  • compatibility with existing infrastructure

This system architecture enables heavy industry to transition toward zero-emission production while maintaining operational reliability and economic viability.

Carbon Recycling Technology

Recently I filed a preliminary patent application on ‘decarbonisation’.
It is a holistic process that uses only seawater and sun to generate a base load power with zero emission using the principle of ‘circular economy’. Somebody asked me to explain this technology in a lay man’s language. It is similar to an example what I explained as follows:
Let me explain in a lay mans’s language. Imagine you fill your car with 50 lit  petrol and go on a trip. The petrol is a Hydrocarbon (chemical term).Suppose I fit a small equipment on the exhaust pipe of your car which will collect the exhaust gases in a liquid form and collect it. When you finish your trip you can remove that equipment which collected your exhaust in a liquid form and hand over to a small processing unit on the road side. The processing unit will convert that exhaust  liquid into Petrol once agin. You can fill your car with this new petrol and also fit your car with new exhaust collector and return back to your destination. It means there is a zero emission from your car. You need not convert your car into electric or do any modification at all. You don’t have to fill your car with new petrol. It is called CRT (carbon recycling technology). It means you don’t need any petrol at all except for the initial filling. Even that can be eliminated by extracting Carbon from sea water and synthesising a Carbon negative Petrol. No pollution at all because of zero emissions. It simply uses the same Carbon atom again and again by substituting the ‘fossil hydrogen’ with’ renewable hydrogen’ with absolutely no emissions. It fulfils all the requirement of a ‘circular economy’ and a Carbon -free atmosphere. What is unique about this technology is it derives Carbon from seawater (where CO2 has already been absorbed from industrial emissions) and converting into Carbon negative synthetic fuel (unlike Carbon neutral synthetic fuels which are made from CO2 emissions that encourages continuous usage of fossil fuels) with cleaner properties. An Oxy combustion will make it a unique fuel of the future. Our current focus is to generate a base load power(24 x7) without any energy storage at all. It is the only technology in the world that generates a base load power (24 x 7) and synthetic fuels such as aviation fuel, marine fuel, petrol, diesel and CNG using only Sun/wind and Seawater.

Poll results and the discussions: A recent poll conducted in Linkedin and the results discussed as follows:

1.According to the poll recently conducted 73% of people said, “decarbonization” means to reduce Carbon emission. How to reduce CO2 emission when every time we switch our lights on or start our car engine CO2 is automatically emitted? It is possible only when the electricity we use (lights or Electric car) have zero or substantially reduced carbon footprint. Each individual house can have roof top solar panel with storage battery just for their consumption so that they can achieve zero carbon footprint. Alternatively small house holds (hundreds to thousands) can collectively install fully automated micro grids for their power generation and distribution network using solar and wind with battery storage and not to export or import from the centralized grid meant for large power generators for industrial applications. They can also have their own gas network (mixture of 80% natural gas + 20% renewable Hydrogen) for individual CHP applications. The centralized grid should have a zero emission or substantially reduced Carbon emission highlighted in the following paragraphs.

2. Zero percent people said Carbon should be substituted entirely by Hydrogen. The top 10 GHG emitting countries can use either EV or Fuel cell vehicles or a combination of these two for transport applications provided the electricity supply have a zero or substantially reduced Carbon footprint. For power and heating/cooling requirements individual houses can install their own CHP units using gas network (a mixture of 80% natural gas + 20% renewable hydrogen). Fuel cell cars can use renewable Hydrogen generated using PV solar/ wind turbine.

3. 13% of the people voted for adding Hydrogen to carbon. A distributed power system using syngas (a mixture of CO and Hydrogen) as a fuel to generate electricity and district heating and cooling using waste heat can be installed. The resulting CO2 emission along with water vapor can be captured and recycled in the form of syngas using PEM or SOFC electrolyzers.

4. 13% of the people voted for Carbon to disappear. I guess they prefer Carbon capture and use or storage (CCUS) or Carbon capture and sequester deep underground. This technology is yet to be proven commercially on large scale especially by power plants using coal. But “making carbon disappear” is impossible because it violates the fundamental law of physics (matter can neither be created or destroyed). It can be stored temporarily deep underground, but I question the technical feasibility and economic viability of such a scheme. Coal has been used for power generation due to its cheap availability and cheap cost of power generation despite a low electrical efficiency at 32%. But CO2 content in the flue gas is only around 11% and recovery of CO2, compression, long distance transportation and sequestration may substantially increase the cost of CO2 disposal making electricity very expensive. It will be simply unviable.

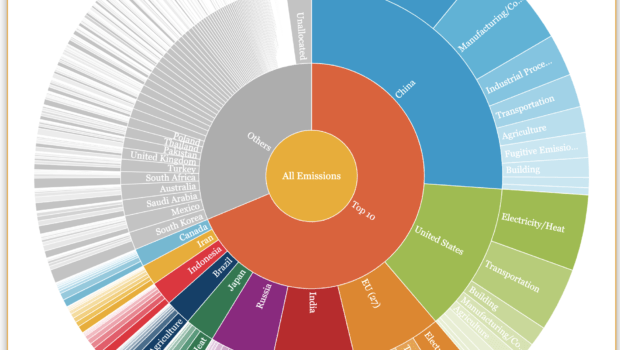
Top 10 GHG (greenhouse gases) emitters in the world

(Source: World resources institute)

The top three GHG emitters- China, EU and USA contribute 41.5% of the total global emissions while the bottom 100 countries account for only 3.6%. Collectively the top 10 emitters account for over two third of the global GHG emissions according to WRI.

Chart, sunburst chart

Description automatically generated

Summary of Life cycle GHG emission intensity (Source: World nuclear association report) 

Technology  Mean  Low  High  
tones CO2e/GWh  
Lignite  1,054  790  1,372  
Coal  888  756  1,310  
Oil  733  547  935  
Natural Gas  499  362  891  
Solar PV  85  13  731  
Biomass  45  10  101  
Nuclear  29  2  130  
Hydroelectric  26  2  237  
Wind  26  6  124  

About 84% % of the world’s energy in the year 2020 was met only by fossil fuels according to Forbes based on BP’s annual review.  Therefore, CO2 emission reduction should be targeted mainly by power generation and transportation industries two major users of fossil fuels.

Various methods of using fossil fuels for power generation and their CO2 emissions are shown below assuming Oxy combustion and gasification are used.

Fuel                  Process                      Reaction               CO2 emission by wt. percentage 

  1. Coal           combustion              C + O2 => CO2           100% 
  • Coal            Gasification        2C + H2O + O2 => CO +H2 +CO2.       97.30% 
  • Natural gas  Combustion        CH4 + 2O2 => CO2 + 2H2O              52 % 
  • Diesel   Combustion     C13H28 + 20 O2 => 13 CO2 + 14 H2O.     69.4 % 

——————————————————————————————————-  

Note: 

THE OXIDANTS USED IN ALL THE ABOVE PROCESSES ARE PURE OXYGEN AND NOT AIR

(Air oxidation will show low CO2 emission by weight percentage due to large portion of Oxides of Nitrogen, Nitrogen and excess oxygen present in the flue gas)

1.By simply closing all coal operations and switching over to natural gas for power generation the CO2 emission can be reduced by 48% compared to coal and by 17.4 % compared to Diesel.  It is critical top 10 emitters of GHG emission should close all their coal fired power plants by 2022 or impose Carbon tax at the rate of $250/Mt to force such closures. CCS or CCUS can be allowed by coal fired power plants provided such technologies are commercially proven and verifiable. Otherwise, Carbon penalty should apply retrospectively.

2 All gas fired power plants can use either natural gas or Syngas (H2 +CO mix) using Oxy combustion to generate power and achieve an electrical efficiency of at least 65% by bottom cycling with sCO2 power cycle using waste heat or 85% using CHP application. Synthetic natural gas (SNG) can substitute natural gas (fossil origin) by using DIC dissolved inorganic in the form of CO2 recovered from seawater and renewable Hydrogen so that SNG will be Carbon negative. Alternatively, CO2 recovered directly from air can be used to synthesize SNG using renewable hydrogen. Carbon pricing will encourage such Carbon negative fuels.  Fuels synthesized from captured CO2 from natural gas fired power plants and hydrogen should be treated as “Carbon neutral’ till 2022 and it should attract carbon tax beyond 2022.

3.Oxy combustion closed super critical CO2 power cycle using natural gas is to be encouraged by enabling pipeline CO2 to be recycled in the form of renewable synthetic methane gas (RSMG) using renewable Hydrogen thus achieving zero emission. It should be confined to individual location and RSMG should not be allowed to be exported but recycled within the premises.

4.CO2 emissions by transport can be reduced by 17.8% by substituting diesel vehicles with CNG by countries other than the top 10 emitters. Top emitting countries can use Fuel cell using renewable Hydrogen banning IC engine using fossil fuels or allow Electric vehicles with Fuel Cell extenders.

5. Deployment of largescale renewables such as solar and wind as well as biomass technologies substituting coal fired power plants will be the key. However renewable energy is only intermittent and will require large scale battery for energy storage. Even battery production emits 150-200 kgs of CO2 per kwh based on the energy consumption @97-181 kwh per kwh battery production (Nearly 200 times more CO2 emission than coal fired power plants). Therefore, utility scale batteries should be justified. Therefore, Bioenergy can play a major role in countries like Australia, African countries, Indonesia, India and Brazil in decarbonization especially biocrude can be converted into renewable synthetic fuels as Carbon neutral fuels.

6. Renewable energy such as solar and wind can be stored in the form of syngas by electrolysis of CO2 emissions from Oxy combustion of natural gas or by gasification of coal as shown above. Low temperature electrolysis using PEM or high temperature electrolysis using SOFC (solid oxide fuel cell) can convert CO2 into syngas. Both the processes have been already demonstrated. Syngas can be stored under pressure, and it can be used as a fuel for a continuous production electricity using Oxy combustion such as sCO2 Brayton cycle and recycling CO2 in the form of Syngas.

CO2 + H2O => H2 + CO (by electrolysis using PEM or SOFC)

7.Using Oxy combustion of natural gas in closed super critical CO2 Bryton power cycle and recycling CO2 internally in the form of RSMG using renewable Hydrogen, ZERO EMISSION base load power can be achieved. The advantage of this system it requires natural gas only for the start-up and it can generate RSMG internally using renewable Hydrogen. It can generate baseload power with zero emissions. And the electrical efficiency of such as system can be up to 65%. It runs completely using only renewable energy sources such as solar and wind. Water electrolysis using PEM or Alkaline Electrolyzer have been commercially proven.

It does not require any energy storage at all. The power can be directly exported to the centralized grid as well as imported from the grid for hydrogen generation. 

By adopting CRT (Carbon recycling technology) outlined above it is possible to achieve zero emissions by power plants and supply power to all industries including transport industries. 

By the introduction of Electric vehicles and Fuel cell vehicles replacing petrol/diesel vehicles the electricity demand will sharply increase in some countries which will proportionately increase GHG emissions. CRT can eliminate GHG emissions as shown above.

The best option is to generate base load electricity with zero GHG emissions using CRT using sCO2 power cycle and recycling CO2 in the form of RSMG and converting waste heat into electricity by bottom cycling using sCO2 power cycle thus increasing the electrical efficiency to more than 70-75%. Advanced bioenergy to convert biomass directly into biomethane can play a major role in decarbonization. It will require massive plantation of high CO2 absorbing short life plant varieties all over the world but unlikely to happen.

Implementation of the above technologies will require massive amount of water especially for renewable hydrogen and for biomass production and gasification and the major source will be the sea. Advancement in seawater desalination such as high recovery, low energy consumption, better concentrate management by recovering value added chemicals and minerals and substituting solar salt by high purity brine directly from seawater desalination will be required, achieving zero liquid discharge in SWRO plants will be critical to eliminate global warming by highly concentrated effluent discharge. All SWRO plants should use only renewable energy sources sch as solar and wind or Hydro.

The above suggestions are purely based on the author’s assessment based on his personal experience in the industry for the past 40 years.

Battery 8hrs and Hydrogen 2 months autonomy24hrs batery storage modelBattery 10hrs and Hydrogen 17hrs autonomyBattery 8hrs and Hydrogen 2 months autonomy172 hrs (one week) battery autonomyAfrica- Australia conference

Most of the renewable energy projects that are now set up around the world are grid connected with feed-in power tariff arrangement. People can generate their own electricity by solar/wind to meet their demand and supply the surplus power to the grid at an agreed power rates. They can also draw power from the grid if there is any short fall in their production of renewable energy. It is two-way traffic. There is an opportunity for people to generate revenue by sale of surplus power. It is an incentive for people to invest on renewable energy and that is why the investment on renewable energy has steadily increased over a time. But this is not the case with many developing and under developed countries. The situation is still worse in many islands where there is no centralized power generation at all or power distribution through grids. They depend on diesel generators. Even to transport diesel from mainland they have to use diesel operated boats. They have no drinking water even though they are surrounded by sea. I happened to visit a remote island in PNG few years ago and saw the plight of those people first hand. They live in absolute poverty and nobody cares to offer them a solution. Their voices are never heard and permanently drowned in the deafening roar of the sea.

The problems of supplying clean power and water to these remote islands are not only political but also technical and commercial in nature. One has to use only commercially available systems and components which are meant for a single or three-phase grid connected power supplies. Even though renewable energy sources basically generate only direct current (DC), one has to convert them into alternate current (AC) for easy distribution and to use appliances which are designed for AC operations. Isolated communities like islands can use direct current and also use DC operated appliances because they are commercially available and they are more efficient. Anyhow most of the house appliances need DC supply and AC/DC converters are commonly used for this purpose thus sacrificing efficiency in the process. They also need better storage solutions because they are not connected to the grid and they have to necessarily store power for several days. Some of these islands are connected with inefficient wind turbines backed by diesel generators. It is an absolute necessity to incorporate a long-term storage capabilities in the system if one has to offer a continuous power and clean water. If the wind velocity is not enough (during off seasons) or if there is no sun (cloudy) for days together and if there is not enough storage capacity, then all the investment made on the project will be of no use. Any half-baked solutions will not serve the real purpose.

There are also commercial problems because a well designed system will cost more, which will eventually increase the power tariff. Unless the Government subsidizes the power   sufficiently, people cannot afford to pay for their electricity or water. It requires a careful planning and community consultations to set up a ‘stand alone renewable energy projects in islands’. Governments in the pacific islands should act with great urgency because there is also a risk of inundation by sea level rising due to global warming.

We are in the process of designing a solution to provide such islands with clean power, clean drinking water and even wireless connectivity for schools so that children can get education. It may sound ambitious but it is the first step one has to take into long journey of sustainability and self-reliance by these isolated communities. There is a good possibility that such island may one day become completely independent and self-sufficient with clean power and water.

The same solution can be implemented in other countries too. Many countries have necessary infrastructure to generate and distribute power yet they suffer regular power cuts and black outs due to inefficiencies in their system.

Our proposed solution can provide uninterrupted clean power and water because the system will have long duration centralized energy storage. We have made a detailed analysis of various alternatives available for the above purpose using Homer hybrid solution software. The solution proposes a PV solar with storage solutions using battery bank as well as Fuel cell back up. The solution also proposes a long duration of storage ranging from few hours up to a fortnight .It is a standalone system with complete energy management and suitable for remote operations. The solution can also incorporate wind turbine in addition to PV solar depending upon the site and wind velocity profile.

The model is to supply clean power and drinking water for 600 families with an average 3 people in a family. The system will supply power at the rate of 1.50kwhrs/day/person (1800 x1.5 = 2700kwhrs/day) and drinking water at the rate of 200 lits/day/person (1800 x 200 lit/person= 360,000 lits/day).The power for a desalination plant will be 1980 kwhrs/day. The system is designed for a total power generation capacity of 4680Khwhrs/day.

The model is based on battery storage as well as based on Hydrogen storage with varying durations. Comparative analysis is shown in the figures.

The first window is based on PV solar with  2 months Hydrogen autonomy.

The third window is based on PV solar with battery storage 5 days and Hydrogen 17hrs autonomy.

The fourth and fifth window is based on PV solar with battery 12hrs and Hydrogen 17hrs storage autonomy with varying panel costs

The sixth window is based on PV solar with 172 hrs (one week) battery autonomy.

The resulting analysis indicates that a centralized Hydrogen storage with Fuel cell back up offers the most economical solution even though the power tariff is higher than a system with battery storage. The investment for long duration battery storage is almost double that of Hydrogen based solution. The cost can further be reduced if and when the Electrolyzers as well as Fuel cells are manufactured on mass scale. The added advantage with this system is it can also provide Hydrogen fuel for Fuel cell cars and boats substituting diesel. One day it may become a reality that these isolated islands can become completely self sufficient in terms of water, fuel and power with no greenhouse gas emissions. This solution can be replicated to all the islands all over the world.

Note:

The above system can also be installed in many developing countries in Africa which is an emerging market. An Africa-Australia Infrastructure Conference  will be held in Melbourne, Australia on 2-3 September  2013 and it will offer a platform for Australian companies to invest in Africa on infrastructural projects.

Battery 8hrs and Hydrogen 2 months autonomy24hrs batery storage modelBattery 10hrs and Hydrogen 17hrs autonomyBattery 8hrs and Hydrogen 2 months autonomy172 hrs (one week) battery autonomyAfrica- Australia conference

Most of the renewable energy projects that are now set up around the world are grid connected with feed-in power tariff arrangement. People can generate their own electricity by solar/wind to meet their demand and supply the surplus power to the grid at an agreed power rates. They can also draw power from the grid if there is any short fall in their production of renewable energy. It is two-way traffic. There is an opportunity for people to generate revenue by sale of surplus power. It is an incentive for people to invest on renewable energy and that is why the investment on renewable energy has steadily increased over a time. But this is not the case with many developing and under developed countries. The situation is still worse in many islands where there is no centralized power generation at all or power distribution through grids. They depend on diesel generators. Even to transport diesel from mainland they have to use diesel operated boats. They have no drinking water even though they are surrounded by sea. I happened to visit a remote island in PNG few years ago and saw the plight of those people first hand. They live in absolute poverty and nobody cares to offer them a solution. Their voices are never heard and permanently drowned in the deafening roar of the sea.

The problems of supplying clean power and water to these remote islands are not only political but also technical and commercial in nature. One has to use only commercially available systems and components which are meant for a single or three-phase grid connected power supplies. Even though renewable energy sources basically generate only direct current (DC), one has to convert them into alternate current (AC) for easy distribution and to use appliances which are designed for AC operations. Isolated communities like islands can use direct current and also use DC operated appliances because they are commercially available and they are more efficient. Anyhow most of the house appliances need DC supply and AC/DC converters are commonly used for this purpose thus sacrificing efficiency in the process. They also need better storage solutions because they are not connected to the grid and they have to necessarily store power for several days. Some of these islands are connected with inefficient wind turbines backed by diesel generators. It is an absolute necessity to incorporate a long-term storage capabilities in the system if one has to offer a continuous power and clean water. If the wind velocity is not enough (during off seasons) or if there is no sun (cloudy) for days together and if there is not enough storage capacity, then all the investment made on the project will be of no use. Any half-baked solutions will not serve the real purpose.

There are also commercial problems because a well designed system will cost more, which will eventually increase the power tariff. Unless the Government subsidizes the power   sufficiently, people cannot afford to pay for their electricity or water. It requires a careful planning and community consultations to set up a ‘stand alone renewable energy projects in islands’. Governments in the pacific islands should act with great urgency because there is also a risk of inundation by sea level rising due to global warming.

We are in the process of designing a solution to provide such islands with clean power, clean drinking water and even wireless connectivity for schools so that children can get education. It may sound ambitious but it is the first step one has to take into long journey of sustainability and self-reliance by these isolated communities. There is a good possibility that such island may one day become completely independent and self-sufficient with clean power and water.

The same solution can be implemented in other countries too. Many countries have necessary infrastructure to generate and distribute power yet they suffer regular power cuts and black outs due to inefficiencies in their system.

Our proposed solution can provide uninterrupted clean power and water because the system will have long duration centralized energy storage. We have made a detailed analysis of various alternatives available for the above purpose using Homer hybrid solution software. The solution proposes a PV solar with storage solutions using battery bank as well as Fuel cell back up. The solution also proposes a long duration of storage ranging from few hours up to a fortnight .It is a standalone system with complete energy management and suitable for remote operations. The solution can also incorporate wind turbine in addition to PV solar depending upon the site and wind velocity profile.

The model is to supply clean power and drinking water for 600 families with an average 3 people in a family. The system will supply power at the rate of 1.50kwhrs/day/person (1800 x1.5 = 2700kwhrs/day) and drinking water at the rate of 200 lits/day/person (1800 x 200 lit/person= 360,000 lits/day).The power for a desalination plant will be 1980 kwhrs/day. The system is designed for a total power generation capacity of 4680Khwhrs/day.

The model is based on battery storage as well as based on Hydrogen storage with varying durations. Comparative analysis is shown in the figures.

The first window is based on PV solar with  2 months Hydrogen autonomy.

The third window is based on PV solar with battery storage 5 days and Hydrogen 17hrs autonomy.

The fourth and fifth window is based on PV solar with battery 12hrs and Hydrogen 17hrs storage autonomy with varying panel costs

The sixth window is based on PV solar with 172 hrs (one week) battery autonomy.

The resulting analysis indicates that a centralized Hydrogen storage with Fuel cell back up offers the most economical solution even though the power tariff is higher than a system with battery storage. The investment for long duration battery storage is almost double that of Hydrogen based solution. The cost can further be reduced if and when the Electrolyzers as well as Fuel cells are manufactured on mass scale. The added advantage with this system is it can also provide Hydrogen fuel for Fuel cell cars and boats substituting diesel. One day it may become a reality that these isolated islands can become completely self sufficient in terms of water, fuel and power with no greenhouse gas emissions. This solution can be replicated to all the islands all over the world.

Note:

The above system can also be installed in many developing countries in Africa which is an emerging market. An Africa-Australia Infrastructure Conference  will be held in Melbourne, Australia on 2-3 September  2013 and it will offer a platform for Australian companies to invest in Africa on infrastructural projects.

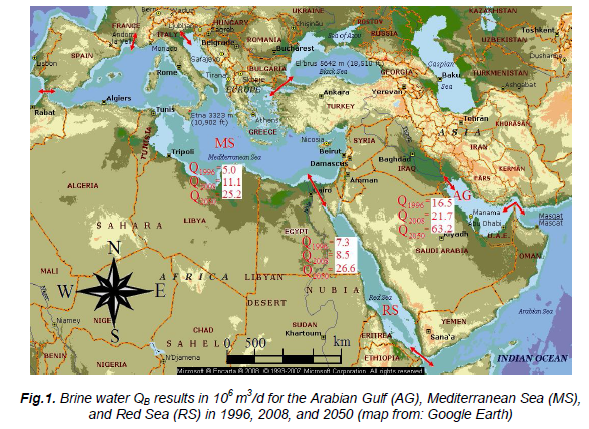
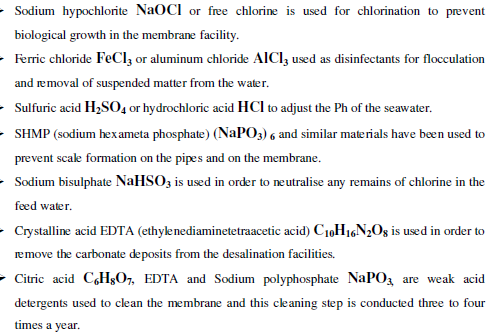
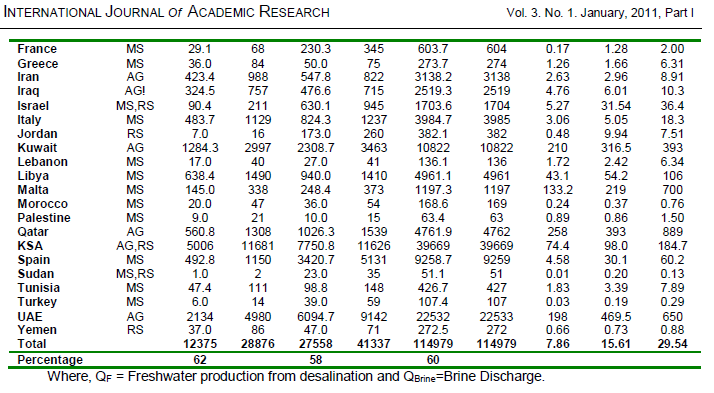
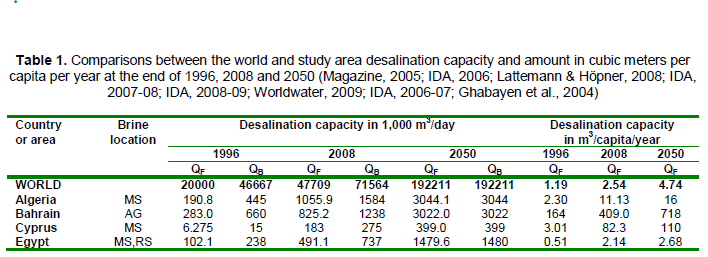
Brine dischage in Gulfchemical usage in desalinationDesal capacityDesalination capacity in the worldsalinity levels in Gulf regionwater cycle

Water and energy are two critical issues that will decide the future of humanity on the planet earth. They determine the security of a nation and that is why there is an increasing competition among nations to achieve self-sufficiency in fresh water and clean energy. But these issues are global issues and we need collective global solutions. In a globalised world the carbon emission of one nation or the effluent discharged into the sea from a desalination plant changes the climate of the planet and affects the entire humanity. It is not just a problem of one nation but a problem of the world. The rich and powerful nations should not pollute the earth, air and sea indiscriminately, hoping to achieve self-sufficiency for themselves at the cost of other nations.  It is very short-sighted policy. Such policies are doomed to fail over a time. Next generation will pay the price for such policies. Industrialised countries and oil rich countries should spend their resources on research and development than on weapons and invent new and creative solutions to address some of the global problems such as energy and water. With increasing population and industrialisation the demand for energy and water is increasing exponentially. But the resources are finite. It is essential that we conserve them, use them efficiently and recycle them wherever possible so that humanity can survive with dignity and in peace. It is possible only by innovation that follows ‘Nature’s path.

The earth’s climate is changing rapidly with unpredictable consequences .Many of us are witnessing  for the first time in our lives unusual weather patterns such as  draughts, flash flooding,  unprecedented   snow falls, bush fires, disease and deaths. Although we consider them as natural phenomena there is an increasing intensity and frequency that tells us a different story. They are human induced and we human beings cause these unprecedented events. When scientists point out human beings cause the globe to warm there were scepticism. We never believed we were capable of changing the entire weather system of the globe.

We underestimate our actions. By simply discharging effluent from our desalination plants into the sea, can we change the salinity of the ocean or by burning coal can we change the climate of the world? The answer is “Yes” according to science. Small and incremental pollution we cause to our air and water in everyday life have dramatic effects because we disturb the equilibrium of the Nature. In order to restore the equilibrium, Nature is forced to act by changing the climate whether we like it or not.

Nature always maintains“equilibrium” that maintains perfect balance and harmony in the world. If any slight changes are made in the equilibrium by human beings then Nature will make sure such changes are countered by a corresponding change that will restore the equilibrium. This is a natural phenomenon. The changes we cause may be small or incremental but the cumulative effect of such changes spanning hundreds of years will affect the equilibrium dramatically.

We depend on fossil fuels for our energy needs. These fossils were buried by Nature millions of years ago. But we dig deep into the earth, bring them to surface and use them to generate power, run our cars and heat our homes. Our appetite for fossil fuels increased exponentially as our population grew. We emitted Carbon into the atmosphere from burning fossil fuels for hundreds of years without many consequences. But the emissions have reached a limit that causes a shift in Nature’s equilibrium and Nature will certainly act to counter this shift and the consequences are changes in our weather system that we are now witnessing. The only way to curtail further Carbon emission into the atmosphere is to capture the current Carbon emissions and convert them into a fuel so that we can recycle them for further power generations without adding fresh fossil fuel into the system while meeting our energy demands.

We can convert Carbon emissions into a synthetic natural gas (SNG) by using Hydrogen derived from water. That is why I always believe ‘Water and energy are two sides of the same coin’. But cost of Hydrogen generation from water will be high and that is the price we will have to pay to compensate the changing climate. Sooner we do better will be the outcome for the world.

In other word the cost of energy will certainly go up whether we price the Carbon by way of trading or impose Carbon tax or pay incentives for renewable energy or spend several billions of dollars for an innovative technology. There is no short cut. This is the reality of the situation. It will be very difficult for politicians to sell this concept to the public especially during election times but they will have no choice.

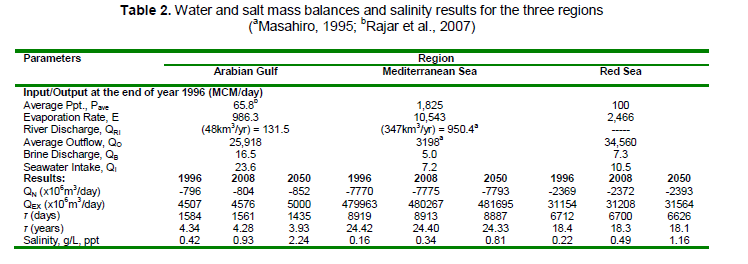
Similarly serious shortage for fresh water in many parts of the world will force nations to desalinate seawater to meet their growing demand. Saudi Arabia one of the largest producers of desalinated water in the world is still planning for the highest capacity of 600,000m3/day. This plant will discharge almost 600,000 m3/day of effluent back into the sea with more than double the salinity of seawater. Over a time the salinity of seawater in the Gulf region has increased to almost 40% higher than it was a decade ago. What it means is their recovery of fresh water by desalination will decrease or their energy requirement will further increase. Any increase in salinity will further increase the fossil fuel consumption (which they have in plenty) will increase the Carbon emission. It is a vicious cycle and the entire world will have to pay the price for such consequences. Small island nations in pacific will bear the brunt of such consequences by inundation of seawater or they will simply disappear into the vast ocean. Recent study by NASA has clearly demonstrated the relationship between the increasing salinity of seawater and the climate change.

According to Amber Jenkins Global Climate Change Jet Propulsion Laboratory:

“We know that average sea levels have risen over the past century, and that global warming is to blame. But what is climate change doing to the saltness, or salinity, of our oceans? This is an important question because big shifts in salinity could be a warning that more severe droughts and floods are on their way, or even that global warming is speeding up...

Now, new research coming out of the United Kingdom (U.K.) suggests that the amount of salt in seawater is varying in direct response to man-made climate change.  Working with colleagues to sift through data collected over the past 50 years, Peter Stott, head of climate monitoring and attribution at the Met Office in Exeter, England, studied whether or not human-induced climate change could be responsible for rises in salinity that have been recorded in the subtropical regions of the Atlantic Ocean, areas at latitudes immediately north and south of Earth’s tropics. By comparing the data to climate models that correct for naturally occurring salinity variations in the ocean, Stott has found that man-made global warming — over and above any possible natural sources of global warming, such as carbon dioxide given off by volcanoes or increases in the heat output of the sun — may be responsible for making parts of the North Atlantic Ocean more salty.

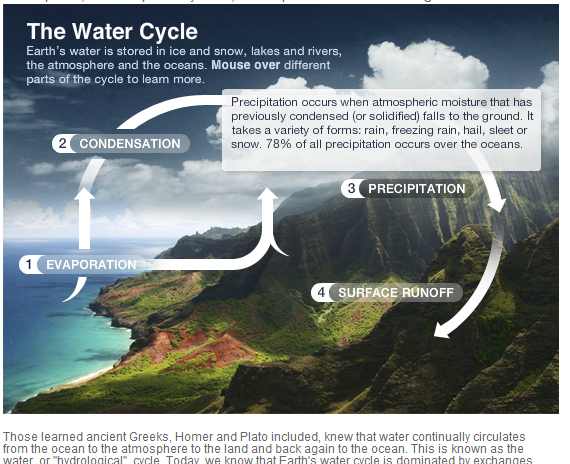
Salinity levels are important for two reasons. First, along with temperature, they directly affect seawater density (salty water is denser than freshwater) and therefore the circulation of ocean currents from the tropics to the poles. These currents control how heat is carried within the oceans and ultimately regulate the world’s climate. Second, sea surface salinity is intimately linked to Earth’s overall water cycle and to how much freshwater leaves and enters the oceans through evaporation and precipitation. Measuring salinity is one way to probe the water cycle in greater detail.”

It is absolutely clear that the way we generate power from fossil fuels and the water we generate from desalination of seawater  cannot be continued as business as usual but requires an innovation. New technologies to generate power without emitting Carbon into the atmosphere and generating fresh water from seawater without dumping the highly saline effluent back into the sea will decide the future of our planet. Discharge of concentrated brine into sea will wipe out the entire fish population in the region. The consequences are dire. Oil rich countries should spend their riches on Research and Developments to find innovative ways of desalinating seawater instead of investing massively on decades old technologies and changing the chemistry of the ocean and the climate forever.


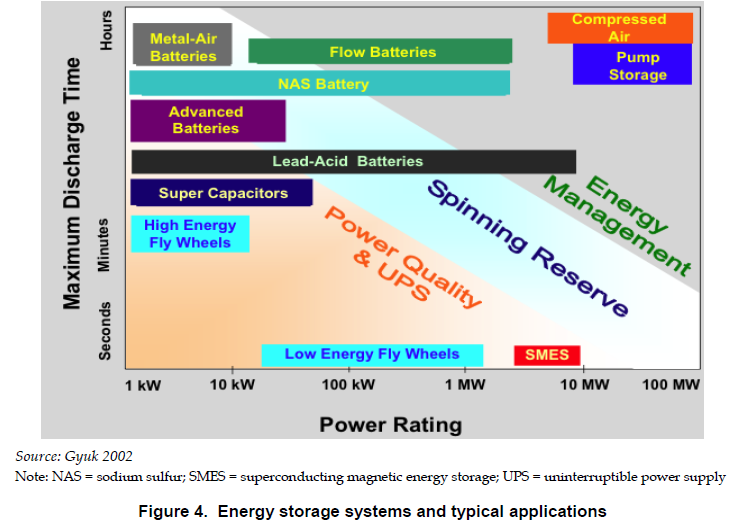
Energy storage systemsFlow batteryReversible fuelcell

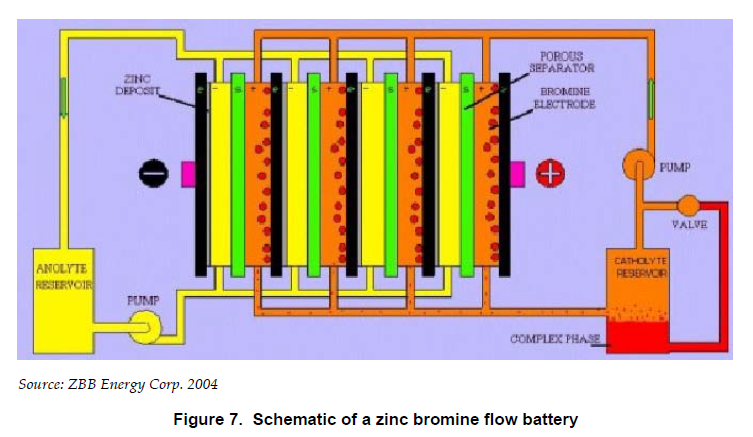
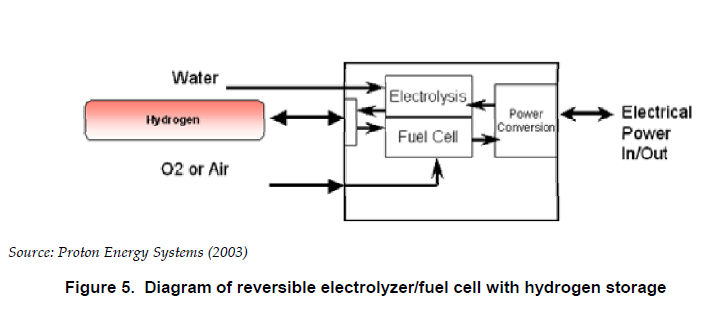
The share of renewable energy is steadily increasing around the world. But storing such intermittent energy source and utilizing it when needed has been a challenge. In fact energy storage makes up a significant part of the cost in any renewable energy technology. Many storage technologies are now available in the commercial market, but choosing a right type of technology has always been a difficult choice. In this article we will consider four types of storage technologies. The California Energy Commission conducted economic and environmental analyses of four energy storage options for a wind energy project: (1) lead acid batteries, (2) zinc bromine (flow) batteries, (3) a hydrogen electrolyzer and fuel cell storage system, and (4) a Hydrogen storage option where the hydrogen was used for fueling hydrogen powered vehicle. Their conclusions were:

”Analysis with NREL’s (National Renewable Energy laboratory)  HOMER model showed that, in most cases, energy storage systems were not well used until higher levels of wind penetration were modeled (i.e., 18% penetration in Southern California in 2020). In our scenarios, hydrogen storage became more cost-effective than battery storage at higher levels of wind power production, and using the hydrogen to refuel vehicles was more economically attractive than converting the hydrogen to electricity. The overall value proposition for energy storage used in conjunction with intermittent renewable power sources depends on multiple factors. Our initial qualitative assessment found the various energy storage systems to be environmentally benign, except for emissions from the manufacture of some battery materials.

However, energy storage entails varying economic costs and environmental impacts depending on the specific location and type of generation involved, the energy storage technology used, and the other potential benefits that energy storage systems can provide (e.g., helping to optimize

Transmission and distribution systems, local power quality support, potential provision of spinning reserves and grid frequency regulation, etc.)”.

Key Assumptions


Key assumptions guiding this analysis include the following:

Wind power will expand in California under the statewide RPS program to a level of

approximately 10% of total energy provided in 2010 and 20% by 2020, with most of

this expansion in Southern California.

• Costs of flow battery systems are assumed to decline somewhat through 2020 and

costs of hydrogen technologies (electrolyzers, fuel cell systems, and storage systems)

are assumed to decline significantly through 2020.

• In the case where hydrogen is produced, stored, and then reconverted to electricity

using fuel cell systems, we assume that the hydrogen can be safely stored in

modified wind turbine towers at relatively low pressure at lower costs than more

conventional and higher-pressure storage.

• In the case where hydrogen is produced and sold into transportation markets, we

assume that there is demand for hydrogen for vehicles in 2010 and 2020, and that the

Hydrogen is produced at the refueling station using the electricity produced from

wind farms (in other words, we assume that transmission capacity is available for

this when needed)?

Key Project Findings


Key findings from the HOMER model projections and analysis include the following:

Energy storage systems deployed in the context of greater wind power development

were not particularly well utilized (based on the availability of “excess” off-peak

electricity from wind power), especially in the 2010 time frame (which assumed 10%

wind penetration statewide), but were better utilized–up to 1,600 hours of operation per

year in some cases–with the greater (20%) wind penetration levels assumed for 2020.

• The levelized costs of electricity from these energy storage systems ranged from a low of

$0.41 per kWh—or near the marginal cost of generation during peak demand times—to

many dollars per kWh (in cases where the storage was not well utilized). This suggests

that in order for these systems to be economically attractive, it may be necessary to

optimize their output to coincide with peak demand periods, and to identify additional

value streams from their use (e.g., transmission and distribution system optimization,

provision of power quality and grid ancillary services, etc.)

• At low levels of wind penetration (1%–2%), the electrolyzer/fuel cell system was either

inoperable or uneconomical (i.e., either no electricity was supplied by the energy storage

system or the electricity provided carried a high cost per MWh).

• In the 2010 scenarios, the flow battery system delivered the lowest cost per energy

stored and delivered.

• At higher levels of wind penetration, the hydrogen storage systems became more

economical such that with the wind penetration levels in 2020 (18% from Southern

California), the hydrogen systems delivered the least costly energy storage.

• Projected decreases in capital costs and maintenance requirements along with a more

durable fuel cell allowed the electrolyzer/fuel cell to gain a significant cost advantage

over the battery systems in 2020.

• Sizing the electrolyzer/fuel cell system to match the flow battery system’s relatively

high instantaneous power output was found to increase the competitiveness of this

system in low energy storage scenarios (2010 and Northern California in 2020), but in

scenarios with higher levels of energy storage (Southern California in 2020), the

Electrolyzer/fuel cell system sized to match the flow battery output became less

competitive.

• In our scenarios, the hydrogen production case was more economical than the

Electrolyzer/fuel cell case with the same amount of electricity consumed (i.e., hydrogen

production delivered greater revenue from hydrogen sales than the electrolyzer/fuel

cell avoided the cost of electricity, once the process efficiencies are considered).

• Furthermore, the hydrogen production system with a higher-capacity power converter

and electrolyzer (sized to match the flow battery converter) was more cost-effective than

the lower-capacity system that was sized to match the output of the solid-state battery.

This is due to economies of scale found to produce lower-cost hydrogen in all cases.

• In general, the energy storage systems themselves are fairly benign from an

environmental perspective, with the exception of emissions from the manufacture of

certain components (such as nickel, lead, cadmium, and vanadium for batteries). This is

particularly true outside of the U.S., where battery plant emissions are less tightly

controlled and potential contamination from improper disposal of these and other

materials are more likely. The overall value proposition for energy storage systems used in conjunction with intermittent renewable energy systems depends on diverse factors.

• The interaction of generation and storage system characteristics and grid and energy

resource conditions at a particular location.

• The potential use of energy storage for multiple purposes in addition to improving the

dependability of intermittent renewable (e.g., peak/off-peak power price arbitrage,

helping to optimize the transmission and distribution infrastructure, load-leveling the

grid in general, helping to mitigate power quality issues, etc.)

• The degree of future progress in improving forecasting techniques and reducing

prediction errors for intermittent renewable energy systems

• Electricity market design and rules for compensating renewable energy systems for their

output

Conclusions


“This study was intended to compare the characteristics of several technologies for providing

Energy storage for utility grids—in a general sense and also specifically for battery and

Hydrogen storage systems—in the context of greater wind power development in California.

While more detailed site-specific studies will be required to draw firm conclusions, we believe

those energy storage systems have relatively limited application potential at present but may

become of greater interest over the next several years, particularly for California and other areas

that is experiencing significant growth in wind power and other intermittent renewable.

Based on this study and others in the technical literature, we see a larger potential need for

energy storage system services in the 2015–2020 time frames, when growth in renewable produced electricity is expected to reach levels of 20%–30% of electrical energy supplied.

Depending on the success in improved wind forecasting techniques and electricity market

designs, the role for energy storage in the modern electricity grids of the future may be

significant. We suggest further and more comprehensive assessments of multiple energy

storage technologies for comparison purposes, and additional site- and technology-specific

project assessments to gain a better sense of the actual value propositions for these technologies

in the California energy system.


This project has helped to meet program objectives and to benefit California in the

Following ways:

Providing environmentally sound electricity. Energy storage systems have the

Potential to make environmentally attractive renewable energy systems more

competitive by improving their performance and mitigating some of the technical issues

associated with renewable energy/utility grid integration. This project has identified the

potential costs associated with the use of various energy storage technologies as a step

toward understanding the overall value proposition for energy storage as a means to

help enable further development of wind power (and potentially other intermittent

renewable resources as well).

Providing reliable electricity. The integration of energy storage with renewable energy

sources can help to maintain grid stability and adequate reserve margins, thereby

contributing to the overall reliability of the electricity grid. This study identified the

potential costs of integrating various types of energy storage with wind power, against

which the value of greater reliability can be assessed along with other potential benefits.

Providing affordable electricity. Upward pressure on natural gas prices, partly as a

function of increased demand, has significantly contributed to higher electricity prices in

California and other states. Diversification of electricity supplies with relatively low-cost

sources, such as wind power, can provide a hedge against further natural gas price

increases. Higher penetration of these other (non-natural-gas-based) electricity sources,

Potentially enabled by the use of energy storage, can reduce the risks of future electricity.”

(Source: California Energy Commission prepared by University of Berkeley).
The recent debate between the presidential nominees in US election has revealed their respective positions on their policies for an energy independent America. Each of them have articulated how they will increase the oil and gas production to make America energy independent, which will  also incidentally create number of jobs in an ailing economy. Each one of them will be spending a billion dollar first, in driving their messages to the voting public. Once elected, they will explore oil and gas aggressively that will make America energy independent. They will also explore solar and wind energy potentials simultaneously to bridge any shortfall. Their policies   seem to be unconcerned with global warming and its impact due to emission of GHG but, rather aggressive in making America an energy independent by generating an unabated emission of GHG in the future. Does it mean an ‘energy independent America’ will spell a doom to the world including US?

The best option for America to become energy independent will be to focus  on energy efficiency of existing technologies and systems, combining renewable fossil fuel energy mix, base load renewable  power and storage technologies, substituting Gasoline with Hydrogen using renewable energy sources. The future investment should be based on sustainable renewable energy sources than fossil fuel. But current financial and unemployment situation in US will force the new president to increase the conventional and unconventional oil and gas production than renewable energy production, which will be initially expensive with long pay pack periods but will eventually meet the energy need in a sustainable way. The net result of their current policies will be an enhanced emission of GHG and acceleration of global warming. But the energy projections in the U.S. Energy Information Administration’s (EIA’s) Annual Energy Outlook 2012 (AEO2012) projects a reduced GHG emission.

According to Annual Energy Outlook 2012 report:

“The projections in the U.S. Energy Information Administration’s (EIA’s) Annual Energy Outlook 2012 (AEO2012) focus on the factors that shape the U.S. energy system over the long-term. Under the assumption that current laws and regulations remain unchanged throughout the projections, the AEO2012 Reference case provides the basis for examination and discussion of energy production, consumption, technology, and market trends and the direction they may take in the future. It also serves as a starting point for analysis of potential changes in energy policies. But AEO2012 is not limited to the Reference case. It also includes 29 alternative cases, which explore important areas of uncertainty for markets, technologies, and policies in the U.S. energy economy. Many of the implications of the alternative cases are discussed in the “Issues in focus” section of this report.

Key results highlighted in AEO2012 include continued modest growth in demand for energy over the next 25 years and increased domestic crude oil and natural gas production, largely driven by rising production from tight oil and shale resources. As a result, U.S. reliance on imported oil is reduced; domestic production of natural gas exceeds consumption, allowing for net exports; a growing share of U.S. electric power generation is met with natural gas and renewable; and energy-related carbon dioxide emissions stay below their 2005 level from 2010 to 2035, even in the absence of new Federal policies designed to mitigate greenhouse gas (GHG) emissions.

The rate of growth in energy use slows over the projection period, reflecting moderate population growth, an extended economic recovery, and increasing energy efficiency in end-use applications.


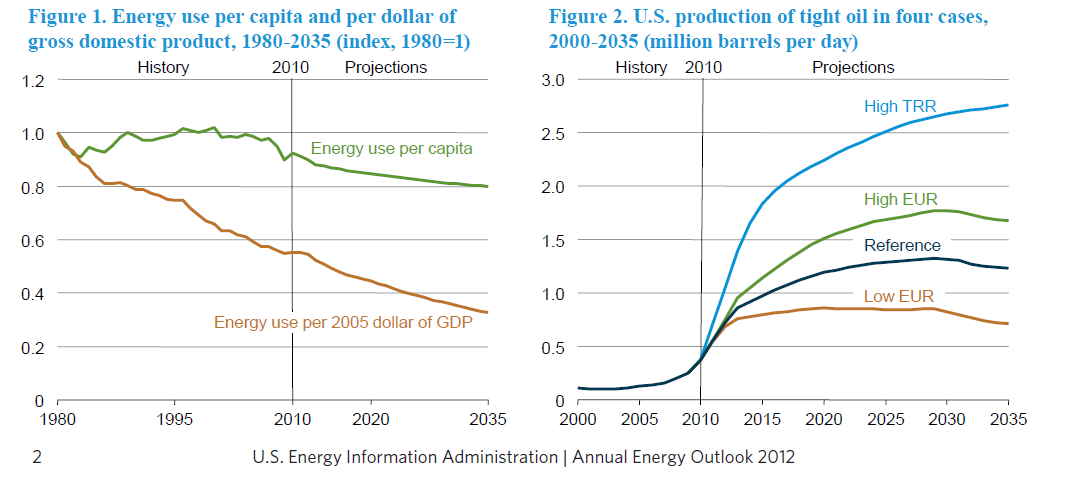
Overall U.S. energy consumption grows at an average annual rate of 0.3 percent from 2010 through 2035 in the AEO2012 Reference case. The U.S. does not return to the levels of energy demand growth experienced in the 20 years before the 2008- 2009 recession, because of more moderate projected economic growth and population growth, coupled with increasing levels of energy efficiency. For some end uses, current Federal and State energy requirements and incentives play a continuing role in requiring more efficient technologies. Projected energy demand for transportation grows at an annual rate of 0.1 percent from 2010 through 2035 in the Reference case, and electricity demand grows by 0.7 percent per year, primarily as a result of rising energy consumption in the buildings sector. Energy consumption per capita declines by an average of 0.6 percent per year from 2010 to 2035 (Figure 1). The energy intensity of the U.S. economy, measured as primary energy use in British thermal units (Btu) per dollar of gross domestic product (GDP) in 2005 dollars, declines by an average of 2.1 percent per year from 2010 to 2035. New Federal and State policies could lead to further reductions in energy consumption. The potential impact of technology change and the proposed vehicle fuel efficiency standards on energy consumption are discussed in “Issues in focus.”

Domestic crude oil production increases

Domestic crude oil production has increased over the past few years, reversing a decline that began in 1986. U.S. crude oil production increased from 5.0 million barrels per day in 2008 to 5.5 million barrels per day in 2010. Over the next 10 years, continued development of tight oil, in combination with the ongoing development of offshore resources in the Gulf of Mexico, pushes domestic crude oil production higher. Because the technology advances that have provided for recent increases in supply are still in the early stages of development, future U.S. crude oil production could vary significantly, depending on the outcomes of key uncertainties related to well placement and recovery rates. Those uncertainties are highlighted in this Annual Energy Outlook’s “Issues in focus” section, which includes an article examining impacts of uncertainty about current estimates of the crude oil and natural gas resources. The AEO2012 projections considering variations in these variables show total U.S. crude oil production in 2035 ranging from 5.5 million barrels per day to 7.8 million barrels per day, and projections for U.S. tight oil production from eight selected plays in 2035 ranging from 0.7 million barrels per day to 2.8 million barrels per day (Figure 2).

With modest economic growth, increased efficiency, growing domestic production, and continued adoption of nonpetroleum liquids, net imports of petroleum and other liquids make up a smaller share of total U.S. energy consumption

U.S. dependence on imported petroleum and other liquids declines in the AEO2012 Reference case, primarily as a result of rising energy prices; growth in domestic crude oil production to more than 1 million barrels per day above 2010 levels in 2020; an increase of 1.2 million barrels per day crude oil equivalent from 2010 to 2035 in the use of biofuels, much of which is produced domestically; and slower growth of energy consumption in the transportation sector as a result of existing corporate average fuel economy standards. Proposed fuel economy standards covering vehicle model years (MY) 2017 through 2025 that are not included in the Reference case would further cut projected need for liquid imports.

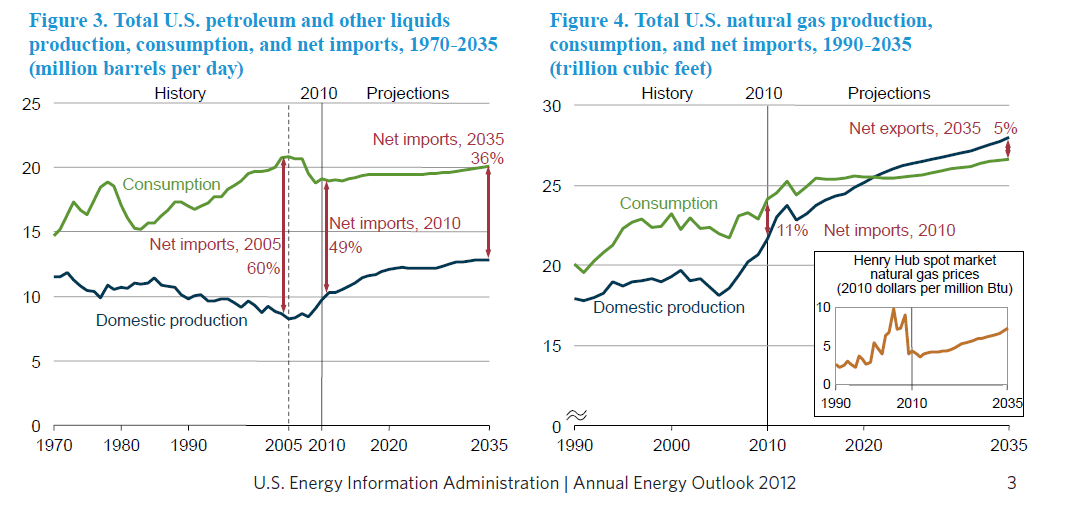
Although U.S. consumption of petroleum and other liquid fuels continues to grow through 2035 in the Reference case, the reliance on imports of petroleum and other liquids as a share of total consumption decline. Total U.S. consumption of petroleum and other liquids, including both fossil fuels and biofuels, rises from 19.2 million barrels per day in 2010 to 19.9 million barrels per day in 2035 in the Reference case. The net import share of domestic consumption, which reached 60 percent in 2005 and 2006 before falling to 49 percent in 2010, continues falling in the Reference case to 36 percent in 2035 (Figure 3). Proposed light-duty vehicles (LDV) fuel economy standards covering vehicle MY 2017 through 2025, which are not included in the Reference case, could further reduce demand for petroleum and other liquids and the need for imports, and increased supplies from U.S. tight oil deposits could also significantly decrease the need for imports, as discussed in more detail in “Issues in focus.”

Natural gas production increases throughout the projection period, allowing the United States to transition from a net importer to a net exporter of natural gas

Much of the growth in natural gas production in the AEO2012 Reference case results from the application of recent technological advances and continued drilling in shale plays with high concentrations of natural gas liquids and crude oil, which have a higher value than dry natural gas in energy equivalent terms. Shale gas production increases in the Reference case from 5.0 trillion cubic feet per year in 2010 (23 percent of total U.S. dry gas production) to 13.6 trillion cubic feet per year in 2035 (49 percent of total U.S. dry gas production). As with tight oil, when looking forward to 2035, there are unresolved uncertainties surrounding the technological advances that have made shale gas production a reality. The potential impact of those uncertainties results in a range of outcomes for U.S. shale gas production from 9.7 to 20.5 trillion cubic feet per year when looking forward to 2035.

As a result of the projected growth in production, U.S. natural gas production exceeds consumption early in the next decade in the Reference case (Figure 4). The outlook reflects increased use of liquefied natural gas in markets outside North America, strong growth in domestic natural gas production, reduced pipeline imports and increased pipeline exports, and relatively low natural gas prices in the United States.

Power generation from renewable and natural gas continues to increase

In the Reference case, the natural gas share of electric power generation increases from 24 percent in 2010 to 28 percent in 2035, while the renewable share grows from 10 percent to 15 percent. In contrast, the share of generation from coal-fired power plants declines. The historical reliance on coal-fired power plants in the U.S. electric power sector has begun to wane in recent years.

Over the next 25 years, the share of electricity generation from coal falls to 38 percent, well below the 48-percent share seen as recently as 2008, due to slow growth in electricity demand, increased competition from natural gas and renewable generation, and the need to comply with new environmental regulations. Although the current trend toward increased use of natural gas and renewable appears fairly robust, there is uncertainty about the factors influencing the fuel mix for electricity generation. AEO2012 includes several cases examining the impacts on coal-fired plant generation and retirements resulting from different paths for electricity demand growth, coal and natural gas prices, and compliance with upcoming environmental rules.

While the Reference case projects 49 gigawatts of coal-fired generation retirements over the 2011 to 2035 period, nearly all of which occurs over the next 10 years, the range for cumulative retirements of coal-fired power plants over the projection period varies considerably across the alternative cases (Figure 5), from a low of 34 gigawatts (11 percent of the coal-fired generator fleet) to a high of 70 gigawatts (22 percent of the fleet). The high-end of the range is based on much lower natural gas prices than those assumed in the Reference case; the lower end of the range is based on stronger economic growth, leading to stronger growth in electricity demand and higher natural gas prices. Other alternative cases, with varying assumptions about coal prices and the length of the period over which environmental compliance costs will be recovered, but no assumption of new policies to limit GHG emissions from existing plants, also yield cumulative retirements within a range of 34 to 70 gigawatts. Retirements of coal-fired capacity exceed the high-end of the range (70 gigawatts) when a significant GHG policy is assumed (for further description of the cases and results, see “Issues in focus”).

Total energy-related emissions of carbon dioxide in the United States stay below their 2005 level through 2035

Energy-related carbon dioxide (CO2) emissions grow slowly in the AEO2012 Reference case, due to a combination of modest economic growth, growing use of renewable technologies and fuels, efficiency improvements, slow growth in electricity demand, and increased use of natural gas, which is less carbon-intensive than other fossil fuels. In the Reference case, which assumes no explicit Federal regulations to limit GHG emissions beyond vehicle GHG standards (although State programs and renewable portfolio standards are included), energy-related CO2 emissions grow by just over 2 percent from 2010 to 2035, to a total of 5,758 million metric tons in 2035 (Figure 6). CO2 emissions in 2020 in the Reference case are more than 9 percent below the 2005 level of 5,996 million metric tons, and they still are below the 2005 level at the end of the projection period. Emissions per capita fall by an average of 1.0 percent per year from 2005 to 2035.

Projections for CO2 emissions are sensitive to such economic and regulatory factors due to the pervasiveness of fossil fuel use in the economy. These linkages result in a range of potential GHG emissions scenarios. In the AEO2012 Low and High Economic Growth cases, projections for total primary energy consumption in 2035 are, respectively, 100.0 quadrillion Btu (6.4 percent below the Reference case) and 114.4 quadrillion Btu (7.0 percent above the Reference case), and projections for energy-related CO2 emissions in 2035 are 5,356 million metric tons (7.0 percent below the Reference case) and 6,117 million metric tons (6.2 percent above the Reference case)”.  (Ref:U.S. Energy Information Administration).

The recent debate between the presidential nominees in US election has revealed their respective positions on their policies for an energy independent America. Each of them have articulated how they will increase the oil and gas production to make America energy independent, which will  also incidentally create number of jobs in an ailing economy. Each one of them will be spending a billion dollar first, in driving their messages to the voting public. Once elected, they will explore oil and gas aggressively that will make America energy independent. They will also explore solar and wind energy potentials simultaneously to bridge any shortfall. Their policies   seem to be unconcerned with global warming and its impact due to emission of GHG but, rather aggressive in making America an energy independent by generating an unabated emission of GHG in the future. Does it mean an ‘energy independent America’ will spell a doom to the world including US?

The best option for America to become energy independent will be to focus  on energy efficiency of existing technologies and systems, combining renewable fossil fuel energy mix, base load renewable  power and storage technologies, substituting Gasoline with Hydrogen using renewable energy sources. The future investment should be based on sustainable renewable energy sources than fossil fuel. But current financial and unemployment situation in US will force the new president to increase the conventional and unconventional oil and gas production than renewable energy production, which will be initially expensive with long pay pack periods but will eventually meet the energy need in a sustainable way. The net result of their current policies will be an enhanced emission of GHG and acceleration of global warming. But the energy projections in the U.S. Energy Information Administration’s (EIA’s) Annual Energy Outlook 2012 (AEO2012) projects a reduced GHG emission.

According to Annual Energy Outlook 2012 report:

“The projections in the U.S. Energy Information Administration’s (EIA’s) Annual Energy Outlook 2012 (AEO2012) focus on the factors that shape the U.S. energy system over the long-term. Under the assumption that current laws and regulations remain unchanged throughout the projections, the AEO2012 Reference case provides the basis for examination and discussion of energy production, consumption, technology, and market trends and the direction they may take in the future. It also serves as a starting point for analysis of potential changes in energy policies. But AEO2012 is not limited to the Reference case. It also includes 29 alternative cases, which explore important areas of uncertainty for markets, technologies, and policies in the U.S. energy economy. Many of the implications of the alternative cases are discussed in the “Issues in focus” section of this report.

Key results highlighted in AEO2012 include continued modest growth in demand for energy over the next 25 years and increased domestic crude oil and natural gas production, largely driven by rising production from tight oil and shale resources. As a result, U.S. reliance on imported oil is reduced; domestic production of natural gas exceeds consumption, allowing for net exports; a growing share of U.S. electric power generation is met with natural gas and renewable; and energy-related carbon dioxide emissions stay below their 2005 level from 2010 to 2035, even in the absence of new Federal policies designed to mitigate greenhouse gas (GHG) emissions.

The rate of growth in energy use slows over the projection period, reflecting moderate population growth, an extended economic recovery, and increasing energy efficiency in end-use applications.


Overall U.S. energy consumption grows at an average annual rate of 0.3 percent from 2010 through 2035 in the AEO2012 Reference case. The U.S. does not return to the levels of energy demand growth experienced in the 20 years before the 2008- 2009 recession, because of more moderate projected economic growth and population growth, coupled with increasing levels of energy efficiency. For some end uses, current Federal and State energy requirements and incentives play a continuing role in requiring more efficient technologies. Projected energy demand for transportation grows at an annual rate of 0.1 percent from 2010 through 2035 in the Reference case, and electricity demand grows by 0.7 percent per year, primarily as a result of rising energy consumption in the buildings sector. Energy consumption per capita declines by an average of 0.6 percent per year from 2010 to 2035 (Figure 1). The energy intensity of the U.S. economy, measured as primary energy use in British thermal units (Btu) per dollar of gross domestic product (GDP) in 2005 dollars, declines by an average of 2.1 percent per year from 2010 to 2035. New Federal and State policies could lead to further reductions in energy consumption. The potential impact of technology change and the proposed vehicle fuel efficiency standards on energy consumption are discussed in “Issues in focus.”

Domestic crude oil production increases

Domestic crude oil production has increased over the past few years, reversing a decline that began in 1986. U.S. crude oil production increased from 5.0 million barrels per day in 2008 to 5.5 million barrels per day in 2010. Over the next 10 years, continued development of tight oil, in combination with the ongoing development of offshore resources in the Gulf of Mexico, pushes domestic crude oil production higher. Because the technology advances that have provided for recent increases in supply are still in the early stages of development, future U.S. crude oil production could vary significantly, depending on the outcomes of key uncertainties related to well placement and recovery rates. Those uncertainties are highlighted in this Annual Energy Outlook’s “Issues in focus” section, which includes an article examining impacts of uncertainty about current estimates of the crude oil and natural gas resources. The AEO2012 projections considering variations in these variables show total U.S. crude oil production in 2035 ranging from 5.5 million barrels per day to 7.8 million barrels per day, and projections for U.S. tight oil production from eight selected plays in 2035 ranging from 0.7 million barrels per day to 2.8 million barrels per day (Figure 2).

With modest economic growth, increased efficiency, growing domestic production, and continued adoption of nonpetroleum liquids, net imports of petroleum and other liquids make up a smaller share of total U.S. energy consumption

U.S. dependence on imported petroleum and other liquids declines in the AEO2012 Reference case, primarily as a result of rising energy prices; growth in domestic crude oil production to more than 1 million barrels per day above 2010 levels in 2020; an increase of 1.2 million barrels per day crude oil equivalent from 2010 to 2035 in the use of biofuels, much of which is produced domestically; and slower growth of energy consumption in the transportation sector as a result of existing corporate average fuel economy standards. Proposed fuel economy standards covering vehicle model years (MY) 2017 through 2025 that are not included in the Reference case would further cut projected need for liquid imports.

Although U.S. consumption of petroleum and other liquid fuels continues to grow through 2035 in the Reference case, the reliance on imports of petroleum and other liquids as a share of total consumption decline. Total U.S. consumption of petroleum and other liquids, including both fossil fuels and biofuels, rises from 19.2 million barrels per day in 2010 to 19.9 million barrels per day in 2035 in the Reference case. The net import share of domestic consumption, which reached 60 percent in 2005 and 2006 before falling to 49 percent in 2010, continues falling in the Reference case to 36 percent in 2035 (Figure 3). Proposed light-duty vehicles (LDV) fuel economy standards covering vehicle MY 2017 through 2025, which are not included in the Reference case, could further reduce demand for petroleum and other liquids and the need for imports, and increased supplies from U.S. tight oil deposits could also significantly decrease the need for imports, as discussed in more detail in “Issues in focus.”

Natural gas production increases throughout the projection period, allowing the United States to transition from a net importer to a net exporter of natural gas

Much of the growth in natural gas production in the AEO2012 Reference case results from the application of recent technological advances and continued drilling in shale plays with high concentrations of natural gas liquids and crude oil, which have a higher value than dry natural gas in energy equivalent terms. Shale gas production increases in the Reference case from 5.0 trillion cubic feet per year in 2010 (23 percent of total U.S. dry gas production) to 13.6 trillion cubic feet per year in 2035 (49 percent of total U.S. dry gas production). As with tight oil, when looking forward to 2035, there are unresolved uncertainties surrounding the technological advances that have made shale gas production a reality. The potential impact of those uncertainties results in a range of outcomes for U.S. shale gas production from 9.7 to 20.5 trillion cubic feet per year when looking forward to 2035.

As a result of the projected growth in production, U.S. natural gas production exceeds consumption early in the next decade in the Reference case (Figure 4). The outlook reflects increased use of liquefied natural gas in markets outside North America, strong growth in domestic natural gas production, reduced pipeline imports and increased pipeline exports, and relatively low natural gas prices in the United States.

Power generation from renewable and natural gas continues to increase

In the Reference case, the natural gas share of electric power generation increases from 24 percent in 2010 to 28 percent in 2035, while the renewable share grows from 10 percent to 15 percent. In contrast, the share of generation from coal-fired power plants declines. The historical reliance on coal-fired power plants in the U.S. electric power sector has begun to wane in recent years.

Over the next 25 years, the share of electricity generation from coal falls to 38 percent, well below the 48-percent share seen as recently as 2008, due to slow growth in electricity demand, increased competition from natural gas and renewable generation, and the need to comply with new environmental regulations. Although the current trend toward increased use of natural gas and renewable appears fairly robust, there is uncertainty about the factors influencing the fuel mix for electricity generation. AEO2012 includes several cases examining the impacts on coal-fired plant generation and retirements resulting from different paths for electricity demand growth, coal and natural gas prices, and compliance with upcoming environmental rules.

While the Reference case projects 49 gigawatts of coal-fired generation retirements over the 2011 to 2035 period, nearly all of which occurs over the next 10 years, the range for cumulative retirements of coal-fired power plants over the projection period varies considerably across the alternative cases (Figure 5), from a low of 34 gigawatts (11 percent of the coal-fired generator fleet) to a high of 70 gigawatts (22 percent of the fleet). The high-end of the range is based on much lower natural gas prices than those assumed in the Reference case; the lower end of the range is based on stronger economic growth, leading to stronger growth in electricity demand and higher natural gas prices. Other alternative cases, with varying assumptions about coal prices and the length of the period over which environmental compliance costs will be recovered, but no assumption of new policies to limit GHG emissions from existing plants, also yield cumulative retirements within a range of 34 to 70 gigawatts. Retirements of coal-fired capacity exceed the high-end of the range (70 gigawatts) when a significant GHG policy is assumed (for further description of the cases and results, see “Issues in focus”).

Total energy-related emissions of carbon dioxide in the United States stay below their 2005 level through 2035

Energy-related carbon dioxide (CO2) emissions grow slowly in the AEO2012 Reference case, due to a combination of modest economic growth, growing use of renewable technologies and fuels, efficiency improvements, slow growth in electricity demand, and increased use of natural gas, which is less carbon-intensive than other fossil fuels. In the Reference case, which assumes no explicit Federal regulations to limit GHG emissions beyond vehicle GHG standards (although State programs and renewable portfolio standards are included), energy-related CO2 emissions grow by just over 2 percent from 2010 to 2035, to a total of 5,758 million metric tons in 2035 (Figure 6). CO2 emissions in 2020 in the Reference case are more than 9 percent below the 2005 level of 5,996 million metric tons, and they still are below the 2005 level at the end of the projection period. Emissions per capita fall by an average of 1.0 percent per year from 2005 to 2035.

Projections for CO2 emissions are sensitive to such economic and regulatory factors due to the pervasiveness of fossil fuel use in the economy. These linkages result in a range of potential GHG emissions scenarios. In the AEO2012 Low and High Economic Growth cases, projections for total primary energy consumption in 2035 are, respectively, 100.0 quadrillion Btu (6.4 percent below the Reference case) and 114.4 quadrillion Btu (7.0 percent above the Reference case), and projections for energy-related CO2 emissions in 2035 are 5,356 million metric tons (7.0 percent below the Reference case) and 6,117 million metric tons (6.2 percent above the Reference case)”.  (Ref:U.S. Energy Information Administration).