Skip navigation

The recent debate between the presidential nominees in US election has revealed their respective positions on their policies for an energy independent America. Each of them have articulated how they will increase the oil and gas production to make America energy independent, which will  also incidentally create number of jobs in an ailing economy. Each one of them will be spending a billion dollar first, in driving their messages to the voting public. Once elected, they will explore oil and gas aggressively that will make America energy independent. They will also explore solar and wind energy potentials simultaneously to bridge any shortfall. Their policies   seem to be unconcerned with global warming and its impact due to emission of GHG but, rather aggressive in making America an energy independent by generating an unabated emission of GHG in the future. Does it mean an ‘energy independent America’ will spell a doom to the world including US?

The best option for America to become energy independent will be to focus  on energy efficiency of existing technologies and systems, combining renewable fossil fuel energy mix, base load renewable  power and storage technologies, substituting Gasoline with Hydrogen using renewable energy sources. The future investment should be based on sustainable renewable energy sources than fossil fuel. But current financial and unemployment situation in US will force the new president to increase the conventional and unconventional oil and gas production than renewable energy production, which will be initially expensive with long pay pack periods but will eventually meet the energy need in a sustainable way. The net result of their current policies will be an enhanced emission of GHG and acceleration of global warming. But the energy projections in the U.S. Energy Information Administration’s (EIA’s) Annual Energy Outlook 2012 (AEO2012) projects a reduced GHG emission.

According to Annual Energy Outlook 2012 report:

“The projections in the U.S. Energy Information Administration’s (EIA’s) Annual Energy Outlook 2012 (AEO2012) focus on the factors that shape the U.S. energy system over the long-term. Under the assumption that current laws and regulations remain unchanged throughout the projections, the AEO2012 Reference case provides the basis for examination and discussion of energy production, consumption, technology, and market trends and the direction they may take in the future. It also serves as a starting point for analysis of potential changes in energy policies. But AEO2012 is not limited to the Reference case. It also includes 29 alternative cases, which explore important areas of uncertainty for markets, technologies, and policies in the U.S. energy economy. Many of the implications of the alternative cases are discussed in the “Issues in focus” section of this report.

Key results highlighted in AEO2012 include continued modest growth in demand for energy over the next 25 years and increased domestic crude oil and natural gas production, largely driven by rising production from tight oil and shale resources. As a result, U.S. reliance on imported oil is reduced; domestic production of natural gas exceeds consumption, allowing for net exports; a growing share of U.S. electric power generation is met with natural gas and renewable; and energy-related carbon dioxide emissions stay below their 2005 level from 2010 to 2035, even in the absence of new Federal policies designed to mitigate greenhouse gas (GHG) emissions.

The rate of growth in energy use slows over the projection period, reflecting moderate population growth, an extended economic recovery, and increasing energy efficiency in end-use applications.


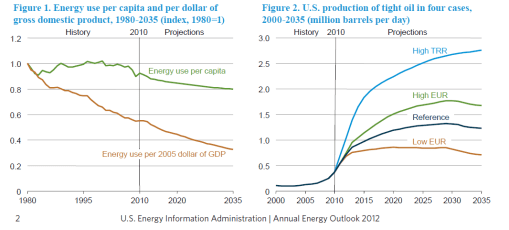
Overall U.S. energy consumption grows at an average annual rate of 0.3 percent from 2010 through 2035 in the AEO2012 Reference case. The U.S. does not return to the levels of energy demand growth experienced in the 20 years before the 2008- 2009 recession, because of more moderate projected economic growth and population growth, coupled with increasing levels of energy efficiency. For some end uses, current Federal and State energy requirements and incentives play a continuing role in requiring more efficient technologies. Projected energy demand for transportation grows at an annual rate of 0.1 percent from 2010 through 2035 in the Reference case, and electricity demand grows by 0.7 percent per year, primarily as a result of rising energy consumption in the buildings sector. Energy consumption per capita declines by an average of 0.6 percent per year from 2010 to 2035 (Figure 1). The energy intensity of the U.S. economy, measured as primary energy use in British thermal units (Btu) per dollar of gross domestic product (GDP) in 2005 dollars, declines by an average of 2.1 percent per year from 2010 to 2035. New Federal and State policies could lead to further reductions in energy consumption. The potential impact of technology change and the proposed vehicle fuel efficiency standards on energy consumption are discussed in “Issues in focus.”

Domestic crude oil production increases

Domestic crude oil production has increased over the past few years, reversing a decline that began in 1986. U.S. crude oil production increased from 5.0 million barrels per day in 2008 to 5.5 million barrels per day in 2010. Over the next 10 years, continued development of tight oil, in combination with the ongoing development of offshore resources in the Gulf of Mexico, pushes domestic crude oil production higher. Because the technology advances that have provided for recent increases in supply are still in the early stages of development, future U.S. crude oil production could vary significantly, depending on the outcomes of key uncertainties related to well placement and recovery rates. Those uncertainties are highlighted in this Annual Energy Outlook’s “Issues in focus” section, which includes an article examining impacts of uncertainty about current estimates of the crude oil and natural gas resources. The AEO2012 projections considering variations in these variables show total U.S. crude oil production in 2035 ranging from 5.5 million barrels per day to 7.8 million barrels per day, and projections for U.S. tight oil production from eight selected plays in 2035 ranging from 0.7 million barrels per day to 2.8 million barrels per day (Figure 2).

With modest economic growth, increased efficiency, growing domestic production, and continued adoption of nonpetroleum liquids, net imports of petroleum and other liquids make up a smaller share of total U.S. energy consumption

U.S. dependence on imported petroleum and other liquids declines in the AEO2012 Reference case, primarily as a result of rising energy prices; growth in domestic crude oil production to more than 1 million barrels per day above 2010 levels in 2020; an increase of 1.2 million barrels per day crude oil equivalent from 2010 to 2035 in the use of biofuels, much of which is produced domestically; and slower growth of energy consumption in the transportation sector as a result of existing corporate average fuel economy standards. Proposed fuel economy standards covering vehicle model years (MY) 2017 through 2025 that are not included in the Reference case would further cut projected need for liquid imports.

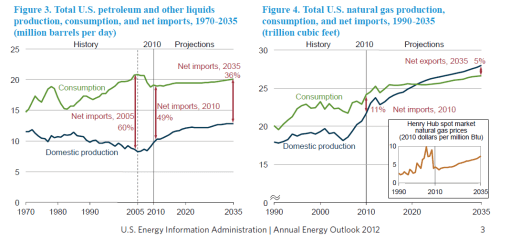
Although U.S. consumption of petroleum and other liquid fuels continues to grow through 2035 in the Reference case, the reliance on imports of petroleum and other liquids as a share of total consumption decline. Total U.S. consumption of petroleum and other liquids, including both fossil fuels and biofuels, rises from 19.2 million barrels per day in 2010 to 19.9 million barrels per day in 2035 in the Reference case. The net import share of domestic consumption, which reached 60 percent in 2005 and 2006 before falling to 49 percent in 2010, continues falling in the Reference case to 36 percent in 2035 (Figure 3). Proposed light-duty vehicles (LDV) fuel economy standards covering vehicle MY 2017 through 2025, which are not included in the Reference case, could further reduce demand for petroleum and other liquids and the need for imports, and increased supplies from U.S. tight oil deposits could also significantly decrease the need for imports, as discussed in more detail in “Issues in focus.”

Natural gas production increases throughout the projection period, allowing the United States to transition from a net importer to a net exporter of natural gas

Much of the growth in natural gas production in the AEO2012 Reference case results from the application of recent technological advances and continued drilling in shale plays with high concentrations of natural gas liquids and crude oil, which have a higher value than dry natural gas in energy equivalent terms. Shale gas production increases in the Reference case from 5.0 trillion cubic feet per year in 2010 (23 percent of total U.S. dry gas production) to 13.6 trillion cubic feet per year in 2035 (49 percent of total U.S. dry gas production). As with tight oil, when looking forward to 2035, there are unresolved uncertainties surrounding the technological advances that have made shale gas production a reality. The potential impact of those uncertainties results in a range of outcomes for U.S. shale gas production from 9.7 to 20.5 trillion cubic feet per year when looking forward to 2035.

As a result of the projected growth in production, U.S. natural gas production exceeds consumption early in the next decade in the Reference case (Figure 4). The outlook reflects increased use of liquefied natural gas in markets outside North America, strong growth in domestic natural gas production, reduced pipeline imports and increased pipeline exports, and relatively low natural gas prices in the United States.

Power generation from renewable and natural gas continues to increase

In the Reference case, the natural gas share of electric power generation increases from 24 percent in 2010 to 28 percent in 2035, while the renewable share grows from 10 percent to 15 percent. In contrast, the share of generation from coal-fired power plants declines. The historical reliance on coal-fired power plants in the U.S. electric power sector has begun to wane in recent years.

Over the next 25 years, the share of electricity generation from coal falls to 38 percent, well below the 48-percent share seen as recently as 2008, due to slow growth in electricity demand, increased competition from natural gas and renewable generation, and the need to comply with new environmental regulations. Although the current trend toward increased use of natural gas and renewable appears fairly robust, there is uncertainty about the factors influencing the fuel mix for electricity generation. AEO2012 includes several cases examining the impacts on coal-fired plant generation and retirements resulting from different paths for electricity demand growth, coal and natural gas prices, and compliance with upcoming environmental rules.

While the Reference case projects 49 gigawatts of coal-fired generation retirements over the 2011 to 2035 period, nearly all of which occurs over the next 10 years, the range for cumulative retirements of coal-fired power plants over the projection period varies considerably across the alternative cases (Figure 5), from a low of 34 gigawatts (11 percent of the coal-fired generator fleet) to a high of 70 gigawatts (22 percent of the fleet). The high-end of the range is based on much lower natural gas prices than those assumed in the Reference case; the lower end of the range is based on stronger economic growth, leading to stronger growth in electricity demand and higher natural gas prices. Other alternative cases, with varying assumptions about coal prices and the length of the period over which environmental compliance costs will be recovered, but no assumption of new policies to limit GHG emissions from existing plants, also yield cumulative retirements within a range of 34 to 70 gigawatts. Retirements of coal-fired capacity exceed the high-end of the range (70 gigawatts) when a significant GHG policy is assumed (for further description of the cases and results, see “Issues in focus”).

Total energy-related emissions of carbon dioxide in the United States stay below their 2005 level through 2035

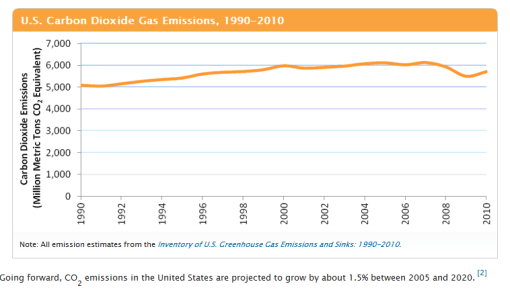
Energy-related carbon dioxide (CO2) emissions grow slowly in the AEO2012 Reference case, due to a combination of modest economic growth, growing use of renewable technologies and fuels, efficiency improvements, slow growth in electricity demand, and increased use of natural gas, which is less carbon-intensive than other fossil fuels. In the Reference case, which assumes no explicit Federal regulations to limit GHG emissions beyond vehicle GHG standards (although State programs and renewable portfolio standards are included), energy-related CO2 emissions grow by just over 2 percent from 2010 to 2035, to a total of 5,758 million metric tons in 2035 (Figure 6). CO2 emissions in 2020 in the Reference case are more than 9 percent below the 2005 level of 5,996 million metric tons, and they still are below the 2005 level at the end of the projection period. Emissions per capita fall by an average of 1.0 percent per year from 2005 to 2035.

Projections for CO2 emissions are sensitive to such economic and regulatory factors due to the pervasiveness of fossil fuel use in the economy. These linkages result in a range of potential GHG emissions scenarios. In the AEO2012 Low and High Economic Growth cases, projections for total primary energy consumption in 2035 are, respectively, 100.0 quadrillion Btu (6.4 percent below the Reference case) and 114.4 quadrillion Btu (7.0 percent above the Reference case), and projections for energy-related CO2 emissions in 2035 are 5,356 million metric tons (7.0 percent below the Reference case) and 6,117 million metric tons (6.2 percent above the Reference case)”.  (Ref:U.S. Energy Information Administration).
The recent debate between the presidential nominees in US election has revealed their respective positions on their policies for an energy independent America. Each of them have articulated how they will increase the oil and gas production to make America energy independent, which will  also incidentally create number of jobs in an ailing economy. Each one of them will be spending a billion dollar first, in driving their messages to the voting public. Once elected, they will explore oil and gas aggressively that will make America energy independent. They will also explore solar and wind energy potentials simultaneously to bridge any shortfall. Their policies   seem to be unconcerned with global warming and its impact due to emission of GHG but, rather aggressive in making America an energy independent by generating an unabated emission of GHG in the future. Does it mean an ‘energy independent America’ will spell a doom to the world including US?

The best option for America to become energy independent will be to focus  on energy efficiency of existing technologies and systems, combining renewable fossil fuel energy mix, base load renewable  power and storage technologies, substituting Gasoline with Hydrogen using renewable energy sources. The future investment should be based on sustainable renewable energy sources than fossil fuel. But current financial and unemployment situation in US will force the new president to increase the conventional and unconventional oil and gas production than renewable energy production, which will be initially expensive with long pay pack periods but will eventually meet the energy need in a sustainable way. The net result of their current policies will be an enhanced emission of GHG and acceleration of global warming. But the energy projections in the U.S. Energy Information Administration’s (EIA’s) Annual Energy Outlook 2012 (AEO2012) projects a reduced GHG emission.

According to Annual Energy Outlook 2012 report:

“The projections in the U.S. Energy Information Administration’s (EIA’s) Annual Energy Outlook 2012 (AEO2012) focus on the factors that shape the U.S. energy system over the long-term. Under the assumption that current laws and regulations remain unchanged throughout the projections, the AEO2012 Reference case provides the basis for examination and discussion of energy production, consumption, technology, and market trends and the direction they may take in the future. It also serves as a starting point for analysis of potential changes in energy policies. But AEO2012 is not limited to the Reference case. It also includes 29 alternative cases, which explore important areas of uncertainty for markets, technologies, and policies in the U.S. energy economy. Many of the implications of the alternative cases are discussed in the “Issues in focus” section of this report.

Key results highlighted in AEO2012 include continued modest growth in demand for energy over the next 25 years and increased domestic crude oil and natural gas production, largely driven by rising production from tight oil and shale resources. As a result, U.S. reliance on imported oil is reduced; domestic production of natural gas exceeds consumption, allowing for net exports; a growing share of U.S. electric power generation is met with natural gas and renewable; and energy-related carbon dioxide emissions stay below their 2005 level from 2010 to 2035, even in the absence of new Federal policies designed to mitigate greenhouse gas (GHG) emissions.

The rate of growth in energy use slows over the projection period, reflecting moderate population growth, an extended economic recovery, and increasing energy efficiency in end-use applications.


Overall U.S. energy consumption grows at an average annual rate of 0.3 percent from 2010 through 2035 in the AEO2012 Reference case. The U.S. does not return to the levels of energy demand growth experienced in the 20 years before the 2008- 2009 recession, because of more moderate projected economic growth and population growth, coupled with increasing levels of energy efficiency. For some end uses, current Federal and State energy requirements and incentives play a continuing role in requiring more efficient technologies. Projected energy demand for transportation grows at an annual rate of 0.1 percent from 2010 through 2035 in the Reference case, and electricity demand grows by 0.7 percent per year, primarily as a result of rising energy consumption in the buildings sector. Energy consumption per capita declines by an average of 0.6 percent per year from 2010 to 2035 (Figure 1). The energy intensity of the U.S. economy, measured as primary energy use in British thermal units (Btu) per dollar of gross domestic product (GDP) in 2005 dollars, declines by an average of 2.1 percent per year from 2010 to 2035. New Federal and State policies could lead to further reductions in energy consumption. The potential impact of technology change and the proposed vehicle fuel efficiency standards on energy consumption are discussed in “Issues in focus.”

Domestic crude oil production increases

Domestic crude oil production has increased over the past few years, reversing a decline that began in 1986. U.S. crude oil production increased from 5.0 million barrels per day in 2008 to 5.5 million barrels per day in 2010. Over the next 10 years, continued development of tight oil, in combination with the ongoing development of offshore resources in the Gulf of Mexico, pushes domestic crude oil production higher. Because the technology advances that have provided for recent increases in supply are still in the early stages of development, future U.S. crude oil production could vary significantly, depending on the outcomes of key uncertainties related to well placement and recovery rates. Those uncertainties are highlighted in this Annual Energy Outlook’s “Issues in focus” section, which includes an article examining impacts of uncertainty about current estimates of the crude oil and natural gas resources. The AEO2012 projections considering variations in these variables show total U.S. crude oil production in 2035 ranging from 5.5 million barrels per day to 7.8 million barrels per day, and projections for U.S. tight oil production from eight selected plays in 2035 ranging from 0.7 million barrels per day to 2.8 million barrels per day (Figure 2).

With modest economic growth, increased efficiency, growing domestic production, and continued adoption of nonpetroleum liquids, net imports of petroleum and other liquids make up a smaller share of total U.S. energy consumption

U.S. dependence on imported petroleum and other liquids declines in the AEO2012 Reference case, primarily as a result of rising energy prices; growth in domestic crude oil production to more than 1 million barrels per day above 2010 levels in 2020; an increase of 1.2 million barrels per day crude oil equivalent from 2010 to 2035 in the use of biofuels, much of which is produced domestically; and slower growth of energy consumption in the transportation sector as a result of existing corporate average fuel economy standards. Proposed fuel economy standards covering vehicle model years (MY) 2017 through 2025 that are not included in the Reference case would further cut projected need for liquid imports.

Although U.S. consumption of petroleum and other liquid fuels continues to grow through 2035 in the Reference case, the reliance on imports of petroleum and other liquids as a share of total consumption decline. Total U.S. consumption of petroleum and other liquids, including both fossil fuels and biofuels, rises from 19.2 million barrels per day in 2010 to 19.9 million barrels per day in 2035 in the Reference case. The net import share of domestic consumption, which reached 60 percent in 2005 and 2006 before falling to 49 percent in 2010, continues falling in the Reference case to 36 percent in 2035 (Figure 3). Proposed light-duty vehicles (LDV) fuel economy standards covering vehicle MY 2017 through 2025, which are not included in the Reference case, could further reduce demand for petroleum and other liquids and the need for imports, and increased supplies from U.S. tight oil deposits could also significantly decrease the need for imports, as discussed in more detail in “Issues in focus.”

Natural gas production increases throughout the projection period, allowing the United States to transition from a net importer to a net exporter of natural gas

Much of the growth in natural gas production in the AEO2012 Reference case results from the application of recent technological advances and continued drilling in shale plays with high concentrations of natural gas liquids and crude oil, which have a higher value than dry natural gas in energy equivalent terms. Shale gas production increases in the Reference case from 5.0 trillion cubic feet per year in 2010 (23 percent of total U.S. dry gas production) to 13.6 trillion cubic feet per year in 2035 (49 percent of total U.S. dry gas production). As with tight oil, when looking forward to 2035, there are unresolved uncertainties surrounding the technological advances that have made shale gas production a reality. The potential impact of those uncertainties results in a range of outcomes for U.S. shale gas production from 9.7 to 20.5 trillion cubic feet per year when looking forward to 2035.

As a result of the projected growth in production, U.S. natural gas production exceeds consumption early in the next decade in the Reference case (Figure 4). The outlook reflects increased use of liquefied natural gas in markets outside North America, strong growth in domestic natural gas production, reduced pipeline imports and increased pipeline exports, and relatively low natural gas prices in the United States.

Power generation from renewable and natural gas continues to increase

In the Reference case, the natural gas share of electric power generation increases from 24 percent in 2010 to 28 percent in 2035, while the renewable share grows from 10 percent to 15 percent. In contrast, the share of generation from coal-fired power plants declines. The historical reliance on coal-fired power plants in the U.S. electric power sector has begun to wane in recent years.

Over the next 25 years, the share of electricity generation from coal falls to 38 percent, well below the 48-percent share seen as recently as 2008, due to slow growth in electricity demand, increased competition from natural gas and renewable generation, and the need to comply with new environmental regulations. Although the current trend toward increased use of natural gas and renewable appears fairly robust, there is uncertainty about the factors influencing the fuel mix for electricity generation. AEO2012 includes several cases examining the impacts on coal-fired plant generation and retirements resulting from different paths for electricity demand growth, coal and natural gas prices, and compliance with upcoming environmental rules.

While the Reference case projects 49 gigawatts of coal-fired generation retirements over the 2011 to 2035 period, nearly all of which occurs over the next 10 years, the range for cumulative retirements of coal-fired power plants over the projection period varies considerably across the alternative cases (Figure 5), from a low of 34 gigawatts (11 percent of the coal-fired generator fleet) to a high of 70 gigawatts (22 percent of the fleet). The high-end of the range is based on much lower natural gas prices than those assumed in the Reference case; the lower end of the range is based on stronger economic growth, leading to stronger growth in electricity demand and higher natural gas prices. Other alternative cases, with varying assumptions about coal prices and the length of the period over which environmental compliance costs will be recovered, but no assumption of new policies to limit GHG emissions from existing plants, also yield cumulative retirements within a range of 34 to 70 gigawatts. Retirements of coal-fired capacity exceed the high-end of the range (70 gigawatts) when a significant GHG policy is assumed (for further description of the cases and results, see “Issues in focus”).

Total energy-related emissions of carbon dioxide in the United States stay below their 2005 level through 2035

Energy-related carbon dioxide (CO2) emissions grow slowly in the AEO2012 Reference case, due to a combination of modest economic growth, growing use of renewable technologies and fuels, efficiency improvements, slow growth in electricity demand, and increased use of natural gas, which is less carbon-intensive than other fossil fuels. In the Reference case, which assumes no explicit Federal regulations to limit GHG emissions beyond vehicle GHG standards (although State programs and renewable portfolio standards are included), energy-related CO2 emissions grow by just over 2 percent from 2010 to 2035, to a total of 5,758 million metric tons in 2035 (Figure 6). CO2 emissions in 2020 in the Reference case are more than 9 percent below the 2005 level of 5,996 million metric tons, and they still are below the 2005 level at the end of the projection period. Emissions per capita fall by an average of 1.0 percent per year from 2005 to 2035.

Projections for CO2 emissions are sensitive to such economic and regulatory factors due to the pervasiveness of fossil fuel use in the economy. These linkages result in a range of potential GHG emissions scenarios. In the AEO2012 Low and High Economic Growth cases, projections for total primary energy consumption in 2035 are, respectively, 100.0 quadrillion Btu (6.4 percent below the Reference case) and 114.4 quadrillion Btu (7.0 percent above the Reference case), and projections for energy-related CO2 emissions in 2035 are 5,356 million metric tons (7.0 percent below the Reference case) and 6,117 million metric tons (6.2 percent above the Reference case)”.  (Ref:U.S. Energy Information Administration).
 

The largest power outage that affected 650 million people in India recently was major news around the world. Power outage is common in many countries including industrialized countries during the times of natural disasters such as cyclones, typhoons and flooding. But the power outage that happened in India was purely man-made. It was not just an accident but a culmination of series of failures as the result of many years of negligence, incompetency and wrong policies. Supplying an uninterrupted power for a democratic country like India with 1.2 billion people with 5-8% annual economic growth, mostly run by Governments of various political parties in various states is by no means an easy task. While one can understand the complexities of the problems involved in power generation and distribution, there are certain fundamental rules that can be followed to avoid such recurrence.

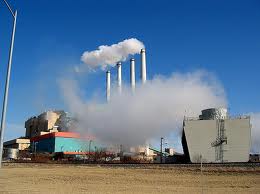
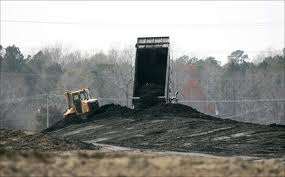
The supply and demand gap for power in India is increasing at an accelerated rate due to economic growth but the power generation and distribution capacity do not match this growth. Most of the power infrastructures in India are owned by Governments who control the power generation, distribution, operation and maintenance, financing power projects, supplying power generation equipment, supplying consumables, supplying fuel, transportation of fuel and revenue collection. The entire system is based on the policy of ‘socialistic democracy’, after the independence from the British, though economic liberalization and globalization is relatively a new phenomenon in India. Since every department of power infrastructure is controlled by Government, there is a lack of accountability and competition. Many private companies and foreign companies do not take part in tendering process because it is a futile exercise. Some smart multinational companies set up their manufacturing facilities in India, often in collaboration with Governments to get an entry into one of the largest market in the world. Indigenous Coal is the dominant fuel widely used for power generation though the quality of coal is very low, with ash content as high as 30%.The calorific value of such coal hardly exceeds 3000 kcal/kg, which means more quantity of coal  is required than any other fuel to generate same amount of power. Such coal generates not only low power but also generates a huge amount of ‘fly ash’ (the ash content is the coal comes out as fly ash) causing pollution and waste disposal problems. Large piles of fly ash and age-old cooling towers with a large pool of stagnant water are common sights in many power plants in India. Such low-cost coal does not make any economic sense when considering the amount of fly ash disposal cost and environmental damages. Thanks to research institutions that have developed methods to utilize fly ash in production of Portland cement. The indigenous low-grade coal is the fuel of choice by Indian power industries, though many plants have started importing coal recently from Indonesia and South Africa. Indigenous low-grade coal and cooling water from rivers and underground sources are two major pollutants in India. Water is allocated for power plants at the cost of agriculture. There is a shortage of drinking water in many cities as well as irrigation water for agriculture.

Since most of the power infrastructures are owned by Governments there is a tendency to adopt populace policies  such as power subsidies, free water and power for farmers, low power tariffs etc, making such projects economically unviable in the long run. Most of the State Electricity boards in India are running at a loss and such accumulated losses amounts to staggering figures. The Central electricity authority regulates the power tariff. They calculate the cost of power generation based on specific fuel and fix the power tariff that companies can charge their consumers even before the plant is set up. Most of such tariffs are based on their experience using indigenous low-grade coal and transport cost which are often impractical. Such low power tariffs are not remunerative for private companies and many foreign companies do not invest in large capital-intensive power projects in India for the same reason.

The best option for the Governments to solve energy problems in India is to open to foreign investments and allow latest technologies in power generation and distribution. It is up to the investing companies to decide the right type of fuel, right of equipment, source and procurement, power technology to be adopted and finally the tariff.  India has come a long way since independence and Governments should focus on Governing rather than managing and controlling infrastructure projects. The latest scam widely debated in Indian media is “Coal scam’. It is time India moves away from fossil fuel and allow foreign investments and technologies in renewable energy projects freely without any interference. India needs large investments in building power and water infrastructures and it possible to attract foreign investment only by infusing confidence in investing companies. It is not just the size of the market that is to be attractive for investors but  they also need a conducive, fair and friendly   environment for such investment.

Coal is still the dominant fuel used for power generation due to its low-cost and abundant availability despite its emission problems and global warming issues. Companies around the world are trying to improve the efficiency of coal-fired power plants and cut emissions by various methods. The idea is to prepare an ultra clean coal with very low ash content in the form of coal-water slurry that can be directly injected into a diesel engine. Direct firing of coal requires micronising to less than 20-30 microns for diesel engine and less than 10 microns for turbines and producing a coal water slurry with at least 50% w/w coal content. The thermal and combustion efficiency of coal water fuel seems to be matching to that diesel engine at up to 1900rpm according to literatures. Still more research is required on engine modification and engine nozzle to handle coal water slurry because of its abrasive nature. If coal can be converted into a fluid like a diesel or Fuel oil then it can substitute diesel at reduced cost. However the Carbon problem needs to be addressed by ongoing research on sequestration.

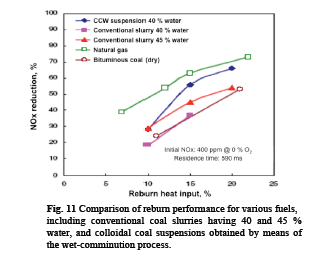
Nanotechnology is an emerging field that offers hope to produce Colloidal coal water fuel that resembles fuel oil that may be suitable for direct injection into diesel engine with little modifications. The colloidal suspensions of coal in water (CCW) are produced using a proprietary wet-combination device. These suspensions are a new material with new properties.

“First, the colloidal fraction plus water is a pseudo fluid good for transport, handling and suspension of large particles. Second, the surface area per unit volume of coal available for chemical reaction and burning is greatly increased and finally, CCW may be milled with a third fluid, seeding the mixture with submicron coal. The colloidal nature of the majority of particles provides for very good features such as outstanding long-term stability, in contrast to regular coal water slurries (CWS) which rapidly sediment under storage. Moreover, the very small particles create an increased reactivity to combustion because small particles with large surface area react faster than large particles with the same volume.”

A company based in Panama has conducted experiments using colloidal coal water fuel and published the following information.

CCW suspension preparation and properties Characterization

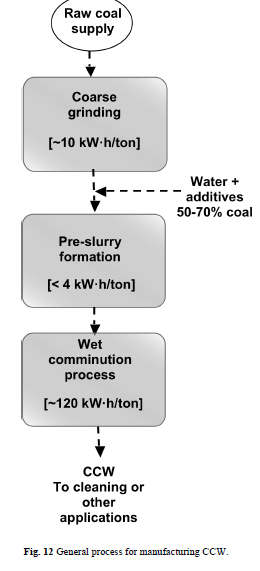
“The colloidal dispersion are prepared in two stages: first by a bench mill and then by our wet- comminuting device. The bench mill was manufactured by IKA®- Group. After grinding,   samples were sieved using mesh size sieves 40 (400 μm), 70 (212 μm) or 140- (106 μm) and the passing particles were retained and used to prepare coal suspensions with various water contents (30 to 50 %), surfactants and other type of additives. These mesh sizes are not foreign to coal-fired power plants.  It is noteworthy that a preliminary formulation study is first necessary to decide the type and concentration of additives that are best suited to improve coal particle wetting and reduce viscosity. The additives were mostly surfactants and viscosity controlling agents and every type of coal tested usually required a specific formulation. In general, it was found that nonionic surfactants were good wetting agents, in concentrations varying from 0.1 to 0.6 w/w %. Some of the additives used to reduce viscosity by decreasing particle interactions, before or after the wet comminuting process, were amines. The suspension formulation previous to the wet-comminuting instance was very simple since what was basically required was a good wetting agent or a combination of two wetting agents. The idea was to have a uniform mixture with as low viscosity as possible.

Particle size of coal samples was determined by direct observation in an optical microscope, or by sieving using five or six different sieves ranging from 20 to 400 μm, or using a laser diffraction apparatus made by Microtrac Corporation, Nanotrac model, having a measurement range from 8 nm to 6.5 μm. Neither of these methods was sufficient to obtain a complete characterization of the particle size distributions, but a combination of the three allowed for a good assessment of what really was in the suspension, before and after the wet-comminuting process.

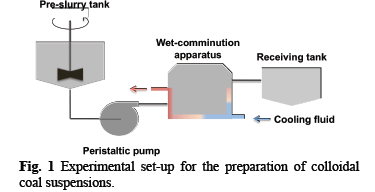
In our study, the percentage of mass passing the 635 mesh size sieve (< 20 μm) was used as an indicator of wet-comminuting process efficiency (generation of colloidal particles), given that microscopic observations generally showed that particles between 8 to 20 μm were very scarce. The preparation of the colloidal suspension of coal was centered in a technology that is totally based on fluid mechanics principles. As mentioned above, a preliminary suspension was prepared in a tank with low agitation and the appropriate water and surfactants contents. This suspension is then fed into a device that spins a film of the fluid to the walls of a cylindrical vessel at very high-speed and under cavitation free conditions. The resulting flow field induces a “particle trap” region where coal particles are locally concentrated above their nominal value and under very high shear. Particles are then milled to very small sizes by a wet-comminuting mechanism. Friction heating is controlled by a chilled water jacket around the vessel.

A schematic view of the set up is shown in the attached figure.

The energy consumed by the wet-comminuting device was evaluated by monitoring the power (voltage and amperage) during the process. The latter has two components, the power required to drive the motor shaft and mechanical seal, and the net power consumed by the fluid during comminuting. It was found that the net power divided by the mass flow rate, in terms of kWH/ton depended on coal content and viscosity of the preliminary slurry, exhibiting values of 30 to 80 kWh/ton. The energy consumed by the motor shaft and seal would account for 50 to 80 % of the total power consumed. Using the method described above, 100 gallons of CCW were prepared, using an Eastern bituminous coal that was previously grinded to 200 mesh. Several properties of this sample were characterized.”

Colloidal coal water fuel has certain distinct advantages over conventional coal water slurry for power generation using conventional diesel engine and turbines. Further research and development work is needed before it can be expanded for large-scale production. But it offers a hope to improve the efficiency of existing coal-fired power plants and reduces emissions.

People in the chemical field will understand the concept of ‘irreversibility’. Certain chemical reactions can go only in one direction and but not in the reverse direction. But some reactions can go on either direction and we can manipulate such reactions to our advantages. This concept has been successfully used in designing many chemical reactions in the past and many innovative industrial and consumer products emerged out of it. But such irreversible reactions also have irreversible consequences because it can irreversibly damage the environment we live in. There is no way such damage can be reversed. That is why a new branch of science called ‘Green Chemistry’ is now emerging to address some of the damages caused by irreversible chemical reactions. It also helps to substitute many synthetic products with natural products. In the past many food colors were made out of coal-tar known as coal-tar dyes. These dyes are used even now in many commercial products. Most of such applications were merely based on commercial attractiveness rather than health issues. Many such products have deleterious health effects and few of them are carcinogenic. We learnt from past mistakes and moved on to new products with less health hazards. But the commercial world has grown into a power lobby who can even decide the fate of a country by influencing political leaders. Today our commercial and financial world has grown so powerful that they can even decides who can be the next president of a country rather than people and policies. They can even manipulate people’s opinion with powerful advertisements and propaganda tactics by flexing their financial muscles.

Combustion of fossil fuel is one such example of ‘irreversibility’ because once we combust coal, oil or  gas,  it will be decomposed into oxides of Carbon, oxide of  Nitrogen and also oxides of Sulfur and Phosphorous depending upon the source of fossil fuel  and purification methods used. These greenhouse gases once emitted into the atmosphere we cannot recover them back. Coal once combusted it is no longer a coal. This critical fact is going to decide our future world for generations to come. Can we bring back billions of tons of Carbon we already emitted into the atmosphere from the time of our industrial revolution? Politicians will pretend not to answer these question and financial and industries lobby will evade these question by highlighting the ‘advancement made by industrial revolutions’. People need electricity and they have neither time nor resources to find an alternative on their own. It is open and free for all. People can be skeptical about these issues because it is ‘inconvenient for them’ to change But can we sustain such a situation?

Irreversibility does not confine only to chemical reactions but also for the environment and sustainability because all are intricately interconnected.Minig industries have scared the earth, power plants polluted the air with greenhouse emission and chemical industries polluted water and these damages are irreversible. When minerals become metals, buried coal becomes power and water becomes toxic effluent then we leave behind an earth that will be uninhabitable for our future generations and all the living species in the world. Is it sustainable and can we call it progress and prosperity? Once we lose pristine Nature by our irreversible actions then that is a perfect recipe for a disaster and no science or technology can save human species from extinction. One need not be scientist to understand these simple facts of life. Each traditional land owners such as Aborigines of Australia or Indians of America and shamans of Indonesia have traditionally known and passed on their knowledge for generations. They too are slowly becoming extinct species in our scientific world because of our irreversible actions. Renewability is the key to sustainability because renewability does not cause irreversible damage to Nature.


All existing power generation technologies including nuclear power plants uses heat generation as a starting point. The heat is used to generate steam which acts as a motive force to run an alternator to produces electricity. We combust fossil fuels such as coal oil and gas to generate above heat which also emits greenhouse gases such as oxides of Carbon and Nitrogen. As I have disused in my earlier article, we did not develop a technology to generate heat without combusting a fossil fuel earlier. This was due to cheap and easy availability of fossil fuel. The potential danger of emitting greenhouse gases into the atmosphere was not realized until recently when scientists pointed out the consequences of carbon build up in the atmosphere. The growth of population and industries around the world pushed the demand for fossil fuels over a period which enhanced the Carbon build up in the atmosphere.

But now Concentrated Solar Power (CSP) systems have been developed to capture the heat of the sun more efficiently and the potential temperature of solar thermal can reach up to 550. This dramatic improvement is the efficiency of solar thermal has opened up new avenues of power generation as well as other applications. “CSP is being widely commercialized and the CSP market has seen about 740 MW of generating capacity added between 2007 and the end of 2010. More than half of this (about 478 MW) was installed during 2010, bringing the global total to 1095 MW. Spain added 400 MW in 2010, taking the global lead with a total of 632 MW, while the US ended the year with 509 MW after adding 78 MW, including two fossil–CSP hybrid plants”. (Ref: Wikipedia)

“CSP growth is expected to continue at a fast pace. As of April 2011, another 946 MW of capacity was under construction in Spain with total new capacity of 1,789 MW expected to be in operation by the end of 2013. A further 1.5 GW of parabolic-trough and power-tower plants were under construction in the US, and contracts signed for at least another 6.2 GW. Interest is also notable in North Africa and the Middle East, as well as India and China. The global market has been dominated by parabolic-trough plants, which account for 90 percent of CSP plants.As of 9 September 2009, the cost of building a CSP station was typically about US$2.50 to $4 per  watt, the fuel (the sun’s radiation) is free. Thus a 250 MW CSP station would have cost $600–1000 million to build. That works out to $0.12 to $0.18/kwt. New CSP stations may be economically competitive with fossil fuels. Nathaniel Bullard,” a solar analyst at Bloomberg

“New Energy Finance, has calculated that the cost of electricity at the Ivanpah Solar Power Facility, a project under construction in Southern California, will be lower than that from  photovoltaic power and about the same as that from natural gas  However, in November 2011, Google announced that they would not invest further in CSP projects due to the rapid price decline of photovoltaics. Google spent $168 million on Bright Source IRENA has published on June 2012 a series of studies titled: “Renewable Energy Cost Analysis”. The CSP study shows the cost of both building and operation of CSP plants. Costs are expected to decrease, but there are insufficient installations to clearly establish the learning curve. As of March 2012, there was 1.9 GW of CSP installed, with 1.8 GW of that being parabolic trough” Ref: Wikipedia.

One Canadian company has demonstrated to generate Hydrogen from water using a catalytic thermolysis using sun’s high temepertaure.The same company has also demonstrated generating base load power using conventional steam turbine by  CSP using parabolic troughs. They store sun’s thermal energy using a proprietary thermic fluid and use them during night times to generate continuous power. The company offers to set up CSP plants of various capacities from 15Mw up to 500Mw.


Renewable Hydrogen offers the most potential energy source of the future for the following reasons. Hydrogen has the highest heat value compared to rest of the fossil fuels such as Diesel, petrol or butane. It does not emit any greenhouse gases on combustion. It can readily be generated from water using your roof mounted solar panels. The electrical efficiency of fuel cell using Hydrogen as a fuel is more than 55% compared to 35% with diesel or petrol engine. It is an ideal fuel that can be used for CHP applications. By properly designing a system for a home, one can generate power as well as use the waste heat to heat or air-condition your home. It offers complete independence from the grid and offers complete insulation from fluctuating oil and gas prices. By installing a renewable Hydrogen facility at your home, you can not only generate Electricity for your home but also fuel your Hydrogen car. The system can be easily automated so that it can take care of your complete power need as well as your fuel requirement for your Hydrogen car. Unlike Electric cars, you can fill two cylinders of a Hydrogen car which will give a mileage of 200miles.You can also charge your electric car with Fuel cell DC power.

Renewable Hydrogen can address all the problems we are currently facing with fossil fuel using centralized power generation and distribution. It will not generate any noise or create any pollution to the environment. It does not need large amount of water. With increasing efficiency of solar panels coming into the market the cost of renewable Hydrogen power will become competitive to grid power. Unlike photovoltaic power, the excess solar power is stored in the form of Hydrogen and there is no need for deep cycle batteries and its maintenance and disposal. It is a one step solution for all the energy problems each one of us is facing. The only drawback with any renewable energy source is its intermittent nature and it can be easily addressed by building enough storage capacity for Hydrogen. Storing large amount of energy is easy compared to battery storage.

The attached ‘You Tube’ video footage show how Solar Hydrogen can be used to power your home and fuel your Hydrogen car. Individual homes and business can be specifically designed based on their power and fuel requirements.

There is a raging debate going on around the world especially in US about the global warming and its causes, among scientists and the public alike. When IPCC released its findings on the connection between greenhouse gas emission and the global warming and its disastrous consequences, there was an overwhelming disbelief and skepticism in many people. In fact many scientists are skeptical even now   about these findings and many of them published their own theories and models to prove their skepticism with elaborate ‘scientific explanations’.   I am not going into details whether greenhouse gas emission induced by human beings causes the globe to warm or not, but certainly we have emitted billions of  tons of Carbon in the form of Carbon dioxide into the atmosphere since industrial revolution. Bulk of these emissions is from power plants fueled by Coal, oil and gas. Why power plants emit so much Carbon into the atmosphere and why Governments around the world allow it in the first place?  When the emission of Oxide of Nitrogen and Sulfur are restricted by EPA why they did not restrict Oxides of carbon? The reason is very simple. They did not have a technology to generate heat without combustion and they did not have a technology to generate power without heat. It was the dawn of industrial revolution and steam engines were introduced using coal as a fuel. The discovery of steam engines was so great and nobody was disturbed by the black smoke it emitted. They knew very well that the efficiency of a steam engine was low as shown by Carnot cycle, yet steam engine was a new discovery and Governments were willing to condone Carbon emission. Governments were happy with steam engine because it could transport millions of people and goods in bulk across the country and Carbon emission was not at all an issue. Moreover carbon emission did not cause any problem like emission of oxides of Sulfur because it was odorless, colorless and it was emitted above the ground level away from human beings. However the effect of Carbon is insidious. Similarly, power generation technology was developed by converting thermal energy into electrical energy with a maximum efficiency of 33%.This means only 33% of the thermal energy released by combustion of coal is converted into electricity. When the resulting electricity is transmitted across thousands of kilometers by high tension grids, further 5-10% power is lost in the transmission. When the high tension power is stepped down through sub stations to lower voltage such as 100/200/400V further 5% power is lost. The net power received by a consumer is only 28% of the heat value of the fuel in the form of electricity. The balance 67% of heat along with Greenhouse gases from the combustion of coal is simply vented out into the atmosphere. It is the most inefficient method to generate power. Any environmental pollution is the direct result of inefficiency of the technology. Governments and EPA around the world ignore this fact .Thank to President Obama who finally introduced the pollution control bill for power plants after 212 years of industrial revolution.  Still this bill did not go far enough to control Carbon emission in its current form. Instead of arguing whether globe is warming due to emission of Carbon by human beings or not, Scientists should focus on improving the science and technology of power generation. For example, the electrical efficiency of a Fuel cell is more than 55% compared to conventional power generation and emits reduced or no carbon. Recent research by MIT shows that such conversion of heat into electricity can be achieved up to 90% compared to current levels of 35%.Had we developed such a technology earlier, probably we will not be discussing about GHG and global warming now. MIT research group is now focusing on developing new type of PV and according to their press release: “Thermal to electric energy conversion with thermophotovoltaics relies on radiation emitted by a hot body, which limits the power per unit area to that of a blackbody. Micro gap thermophotovoltaics take advantage of evanescent waves to obtain higher throughput, with the power per unit area limited by the internal blackbody, which is n2 higher. We propose that even higher power per unit area can be achieved by taking advantage of thermal fluctuations in the near-surface electric fields. For this, we require a converter that couples to dipoles on the hot side, transferring excitation to promote carriers on the cold side which can be used to drive an electrical load. We analyze the simplest implementation of the scheme, in which excitation transfer occurs between matched quantum dots. Next, we examine thermal to electric conversion with a glossy dielectric (aluminum oxide) hot-side surface layer. We show that the throughput power per unit active area can exceed the n2 blackbody limit with this kind of converter. With the use of small quantum dots, the scheme becomes very efficient theoretically, but will require advances in technology to fabricate.” Ref:J.Appl.Phys. 106,094315c(2009); http://dx.doi.org/10.1063/1.3257402 “Quantum-coupled single-electron thermal to electric conversion scheme”. Power generation and distribution using renewable energy sources and using Hydrogen as an alternative fuel is now emerging. Distributed energy systems may replace centralized power plants in the future due to frequent grid failures as we have seen recently in India. Most of the ‘black outs’ are caused  by grid failures due to cyclones, tornadoes and other weather related issues, and localized distribution system with combined heat and power offers a better alternative. For those who are skeptical about global warming caused by man-made greenhouse gases the question still remains, “What happened to billions of tons of Caron dioxide emitted into  the atmosphere by power plants and transportation  since industrial revolution?”.          

The world is debating on how to cut carbon emission and avert the disastrous consequences of global warming. But the emissions from fossil fuels continue unabated while the impact of global warming is being felt all over the world by changing weathers such as flood and draught. It is very clear that the current rate of carbon emission cannot be contained by merely promoting renewable energy at the current rate. Solar, wind, geothermal, ocean wave and OTEC (ocean thermal energy conversion) offer clean alternative energy but now their total combined percentage of energy generation   is only less than 20% of the total power generation. The rate of Carbon reduction by  renewable energy  do not match  the rate of Carbon emission increase by existing and newly built  fossil power generation and transportation, to keep up the current level of Carbon in the atmosphere. The crux of the problem is the rate of speed with which we can cut the Carbon emission in the stipulated time frame. It is unlikely to happen without active participation of industrialized countries such as US, China, India, Japan, EU and Australia by signing a legally binding agreement in reducing their Carbon emissions to an accepted level. However, they can cut their emissions by increasing the efficiency of their existing power generation and consumption by innovative means.

One potential method of carbon reduction is by substituting fossil fuels with biomass in power generation and transportation. By using this method the energy efficiency is increased from current level of 33% to 50-60% in power generation by using gasification technologies and using Hydrogen for transportation. The Fixed carbon in coal is about 70% while the Carbon content in a biomass is only 0.475 X B (B-mass of oven-dry biomass). For example, the moisture content of a dry wood is about 19%,which means the Carbon mass is only 38% in the biomass. To substitute fossil fuels, the world will need massive amounts of biomass. The current consumption of coal worldwide is 6.647 billion tons/yr  (Source:charts bin.com)and the world will need at least 13 billion tons/yr of biomass to substitute coal .The total biomass available in the world in the form of forest is 420 billion tons which means about 3% of the forest in the world will be required to substitute current level of coal consumption. This is based on the assumption that all bioenergy is based on gasification of wood mass. But in reality there are several other methods of bioenergy such as biogas, biofuels such as alcohol and bio-diesel from vegetable oils etc, which will complement biogasification to cut Carbon emission.

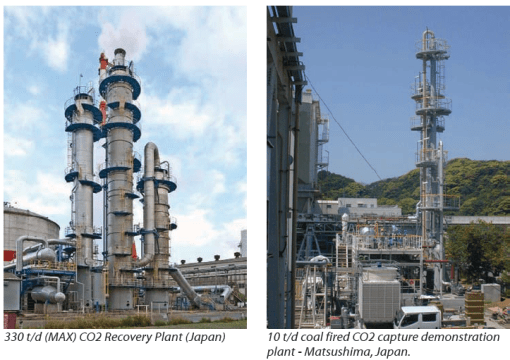
Another potential method is to capture and recover Carbon from existing fossil fuel power plants. The recovered Carbon dioxide has wider industrial applications such as industrial refrigeration and in chemical process industries such as Urea plant. Absorption of Carbon dioxide from flue gas using solvents such as MEA (mono ethanolamine) is a well established technology. The solvent MEA will dissolve Carbon dioxide from the flue gas and the absorbed carbon dioxide will be stripped in a distillation column to separate absorbed carbon dioxide and the solvent. The recovered solvent will be reused.

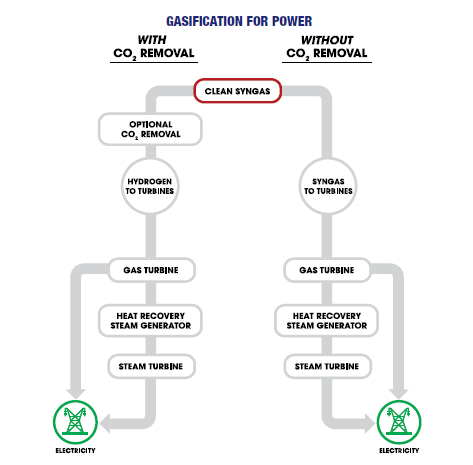
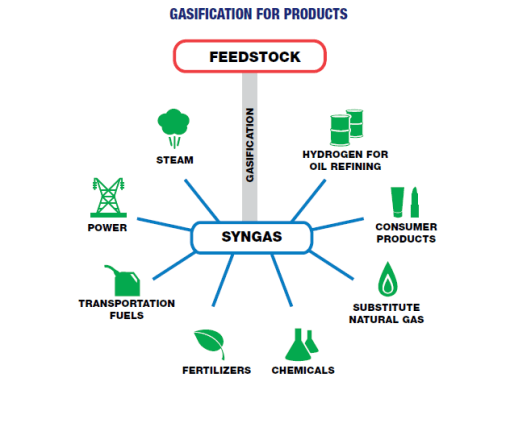
The carbon emission can be reduced by employing various combinations of methods such as anaerobic digestion of organic matters, generation of syngas by gasification of biomass, production of biofuels, along with other forms of renewable energy sources mentioned above. As I have discussed in my previous articles, Hydrogen is the main source of energy in all forms of Carbon based fuels and generating Hydrogen from water using renewable energy source is one of the most potential and expeditious option to reduce Carbon emission.

Biogas is fast becoming a fuel of the choice for rural economy in many parts of the world because large number of agriculture and farming communities lives in rural area. Most of these countries depend on imported   Diesel, LPG and Gasoline for their industries, agriculture, transportation and cooking. Countries like India with large population spends a huge amount of foreign currency towards import of petroleum products, making it more vulnerable to the fluctuating oil and gas prices in the international market. However, there is an increasing awareness in India recently about the importance of generating biogas as an alternative energy source to fossil fuel because 70% of the Indian population lives in rural areas. With an estimated cattle population of 280 million (National Dairy development Board 2010) there is a potential to generate biogas at 19,500 Mw.

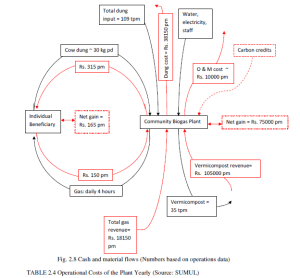
The following calculation is based on the costing details provided by successful case studies of community based Biogas plants in India. One community based biogas plant has 121 families consisting of 5 members per family as stake holders. They supply cow dung at the rate of 4.50 Mt/day for 365days in a year and generate biogas by an anaerobic digester, designed and constructed locally. Biogas is supplied to all the stakeholders every day for 2 hrs in the morning and for about 2 hrs in the evening for cooking. This is equal to burning 3025 kgs of wood/day (121 families x 5members/family x 5kg wood per member= 3025 x 4000 kcal/kg= 12.10 mil Kcal/day= 48.40 mmBtu/day).The piped natural gas in India is supplied now at the rate of $16/mm Btu, which means the plant is able to generate revenue worth $774.40 per day. But each family of 5 members are charged only Rs.150 per month or 121 families are charged 121 x Rs.150= Rs.18, 150/month ($363/month). The family members also supply milk to co-operative dairy farm which has also contributed to set up the biogas plant. Total cost of the project is $43,000 of which Government subsidy is $20,000, Dairy farm contribution $ 16,000 and the stake holders $7000.The economic and social benefit of this project is enormous. The economic benefit by way of fuel savings, revenue from the sale of vermin compose and by way of Carbon credit amounts to Rs.48,94,326 ($97,926/yr).(source:SUMUL).

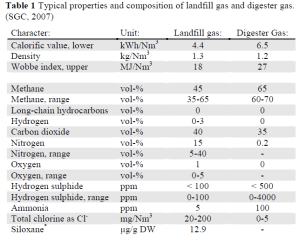
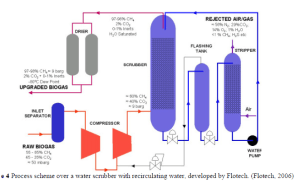
The above case study clearly shows how successfully India can adopt bioenergy as an alternative to fossil fuel in rural areas. We have already seen how biogas can be enriched to increase its methane content and to remove other impurities by way of water scrubbing as shown in the figure. The purified and dried biogas with Methane content 97% and above can be liquefied using cryogenic process by chilling to -162C.The liquefaction of biogas is energy intensive but it is worth doing  in countries like India especially when there is no natural gas pipeline network.BLG (liquefied biogas)  is an ideal fuel for industries with CHP (combined heat and power) applications with energy efficiency exceeding 80% compared to conventional diesel engine efficiency at 30%.By installing LBG service station and catering to transport industry, India can cut their import of crude oil while reducing the greenhouse gas emissions.

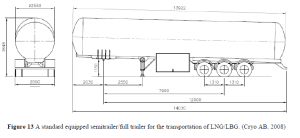
Producing LBG also leads to a renewable fuel available for heavier vehicles. The fuel can be stored as LBG on the vehicle, which increase the driving distance per tank. The need is that the vehicle is running frequently, otherwise LBG will vaporize and CH4 will be vented to the atmosphere. LBG is in liquid form only when the gas is stored on the vehicle. When it gets to the engine it is in its gas phase. When LBG is delivered to remote fuel stations or storages it is transported in vacuum insulated pressure vessels. One such manufacture of these semi-trailers is Cryo AB and the dimensions of a standard equipped semi-trailer, suitable for Nordic logistic conditions, is shown in Figure 13.

This trailer is optimized for the transportation of LNG/LBG and has a tank capacity of 56,000 liters (~33,000 Nm3 LBG). It is vacuum insulated and the heat in-leakage is less than 0.9 % of maximum payload LBG per 24 hour. The maximum payload is 83.7 % filling rate at 0 bar (g) (=19,730 kg). The source of heat is the surrounding air and the heat in-leakage raises the pressure of the LBG. The maximum working pressure is 7.0 bar (g). If this pressure is exceeded gas is vented to the atmosphere through a safety valve. (Cryo AB, 2008)

Fuel station technology:

There are three different types of fuel station available, using LBG as a feed stock:

– LBG refueling station

– LCBG refueling station

– Multi-purpose refueling station

LBG stations fuel LBG to vehicles equipped with a cryogenic tank while LCBG stations refuel CBG. LCBG stands for liquid to compressed biogas and LBG is transformed to CBG at the refueling station. Multi-purpose refueling stations are able to fuel both LBG and CBG, and consist of one LBG part and one LCBG part. (Vanzetti Engineering, 2008a) There are a number of companies in the LNG business working with the development of fuel stations using LBG as a feedstock. The presented data in this text is based on information from three different companies; Cryostat, Nexgen fuels and Vanzetti Engineering.

This article will focus on the multi-purpose station and since the three companies’ designs are very similar, only a general description will be presented.

The reason why the multi-purpose station is chosen is because LBG could be a good alternative for heavier vehicles. Here it is assumed that these vehicles already are available and in use on a large extent. The refueling station assumes to be situated in conjunction with one of the frequent roads in India, not in vicinity with the gas network. The following requirements lie as a background for the design:

– Possibility to fuel both LBG and CBG

– One double dispenser for CBG; one nozzle for vehicles (NGV-1) and one nozzle for busses (NGV-2)

– One single nozzle for LBG

– Expected volume of sale: 3000 Nm3/day

– Pressure on CBG: up to 230 bar (200 bars at 15°C)

The standard equipment on the multi-purpose station consists of a storage tank for LBG, cryogenic pumps, ambient vaporizer, odorant injection system and dispensers. (Cryostat, 2008a)

There are three types of cryogenic pumps:

– Reciprocating

– Centrifugal

– Submerged

Reciprocating pumps are able to function at very high pressures and are used for the filling of buffer tanks and gas cylinders. Centrifugal pumps are able to produce high flow rates and are used for the transfer of cryogenic liquids between reservoir tanks or road tankers. (Cryostat, 2008b) A submerged pump is a centrifugal pump installed inside a vacuum insulated cryogenic tank. This tank is totally submerged in the cryogenic liquid, which makes it stay in permanently cold conditions. (Vanzetti Engineering, 2008b)

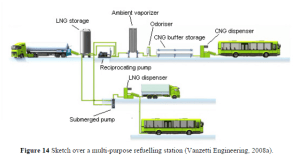
A sketch over a multi-purpose station can be seen in Figure 14. LBG is stored in a vacuum insulated cryogenic vessel and LBG is delivered with semi-trailers. The volume of the storage tank is usually designed to match refilling on a weekly basis. The transfer from trailer is either done by gravity or by transfer pumps, the latter significantly reducing transfer time. (Vanzetti Engineering, 2008a) From the LBG storage tank the station is divided into two; the LBG part and the LCBG part.

The LCBG part consists of a reciprocating pump, an ambient vaporizer and buffer storage. The reciprocating pump sucks LBG from the storage tank and raises the pressure to around 300 bars, before sending it to the ambient high pressure vaporizer. CBG is then odorized before going to the CBG storage and the dispenser. The buffer unit is gas vessel storage, with a maximum working pressure of 300 bar, enabling fast filling of vehicles. (Nexgen Fueling, 2008)

The LBG part only consists of a centrifugal pump that transfers LBG from the storage tank, through vacuum insulated lines, to the LBG dispenser that dispense LBG at a pressure of 5-8 bar. (Nexgen Fueling, 2008) Some LBG dispensers are supplied with a system for the recovery of the vehicle boil of gas. (Cryostar, 2008a) To reduce methane losses all venting lines are collected and sent back to the higher parts of the storage tank, to be reliquaries by the cold LBG. (Heisch, 2008) (Ref: Nina Johanssan, Lunds Universitet)

Economics of LBG: The LNG trucks averages about 2.8 miles per gallon of LNG, equating to about 4.7 miles per DEG. Table 5 compares the energy content, fuel economy and DEG fuel economy. The greenhouse emission is completely eliminated by using LBG.